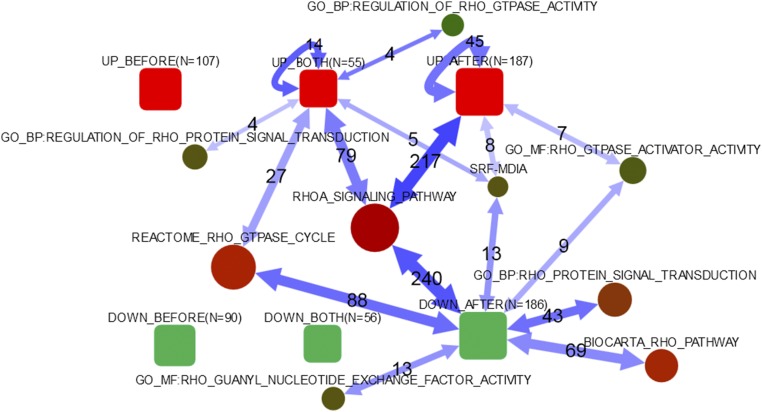
Fig. 5.
Network enrichment of differentially expressed genes in pathways related to RhoA regulation. Global patterns in regard to pathways related to Rho signaling. Connectivity between DE lists and individual genes of the SRF–mDia pathway. Rounded boxes: lists of differentially expressed genes; AFTER, after coculturing; BEFORE, before coculturing; BOTH, both before and after coculturing; DOWN, down-regulation because of RhoA knock-out of ≥twofold; N, number of genes in list; UP, up-regulation due to RhoA KO of ≥ twofold. Circles: pathways; the size reflects the number of member genes, the color indicates the relative activity in the global network (total number of links). Double-headed arrows summarize individual gene–gene connections (in either direction, and undirected ones) in the global network between any differentially expressed genes and any pathway members. Numeric labels give numbers of individual gene–gene network connections behind the arrows. Only arrows corresponding to significant network enrichment are shown (adjusted P < 0.05). The lists of the genes in each group are given in Datasets S1–S6. The data on the SRF–mDia pathway are shown as described previously (24, 25).

