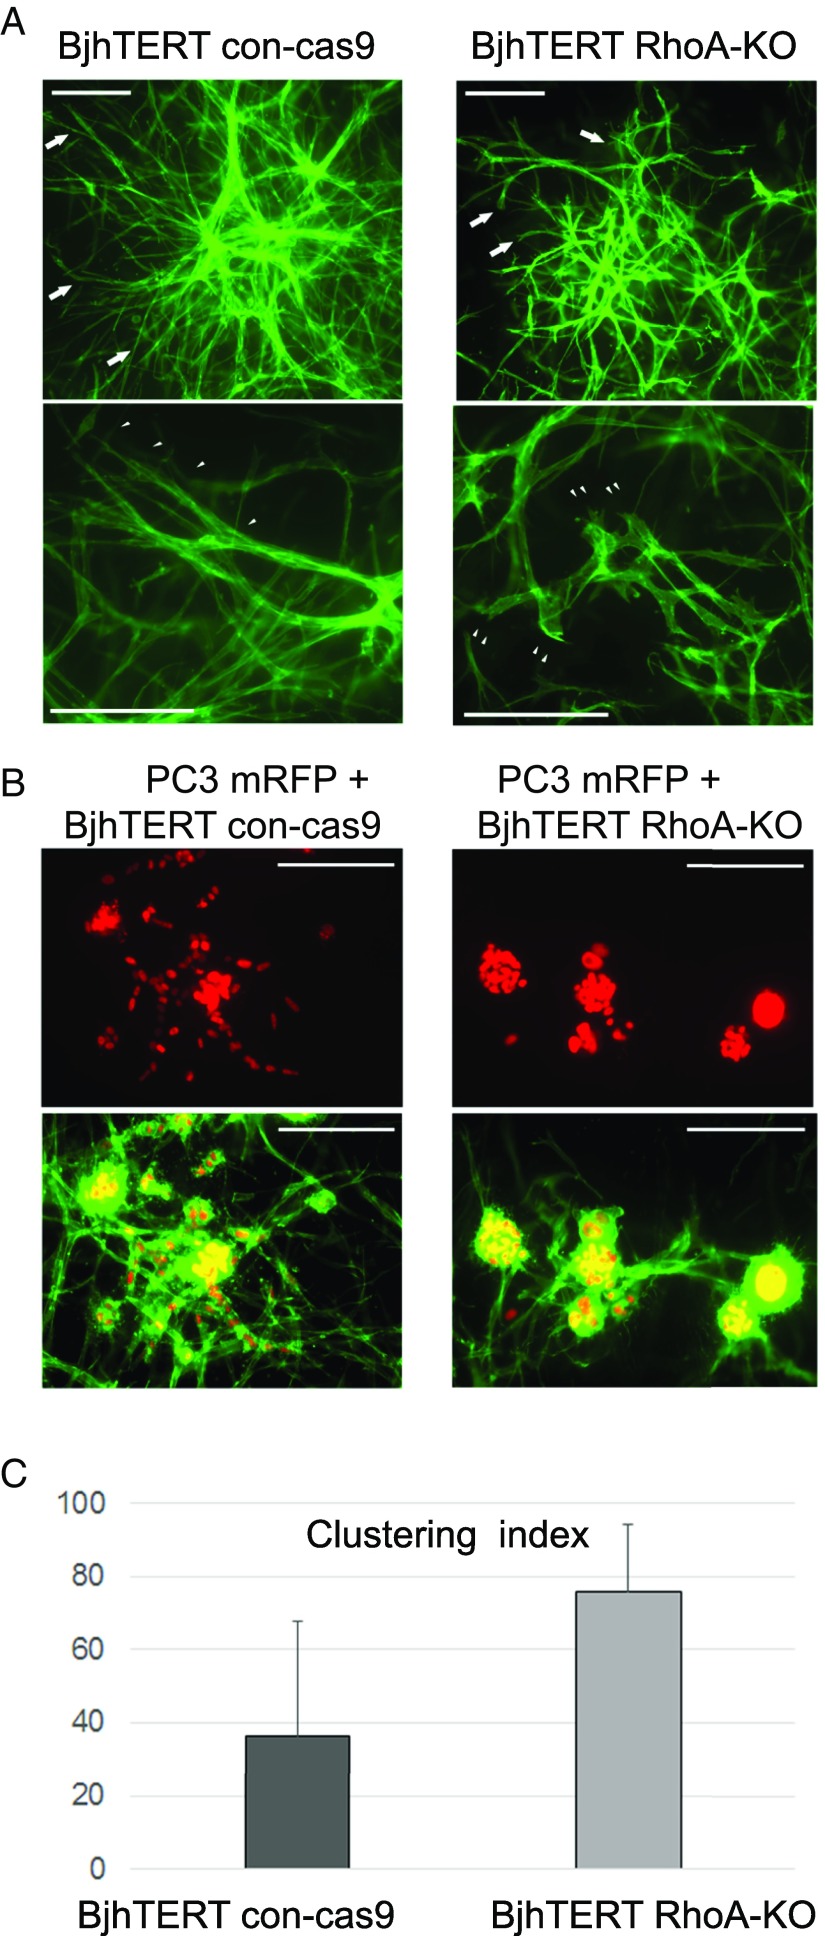
Fig. 6.
Growth of PC3 tumor cells with RhoA-KO fibroblasts in 3D collagen. (A) Phenotypes of control (cont-cas9) and RhoA-KO BjhTERT fibroblasts cultured for 7 d in the 3D type I collagen matrix. Arrows indicate differences in sprouting ability between control and RhoA-KO fibroblasts. Higher magnifications and arrowheads indicate elongated sprouting in control compared with RhoA-KO fibroblasts with the blunt-ended phenotype. (B) To assess growth of PC3 tumor cells with RhoA-KO fibroblasts in 3D collagen, equal numbers of PC3mRFP cells and BjhTERT control or RhoA-KO fibroblasts were suspended as single cells into 3D collagen and cultured for 7 d. (C) Clustering Index calculated to quantify the spreading and compactness of growth of PC3 tumor spheres in coculture with RhoA-KO fibroblasts. For the Clustering Index, the number of sprouting growths was calculated (total n = 16 image fields from two independent repeats) and subtracted from a constant value: Clustering Index = [20 − (mean number of sprouting growths)] ×5. (Scale bars, 200 µm.)

