Fig. S5.
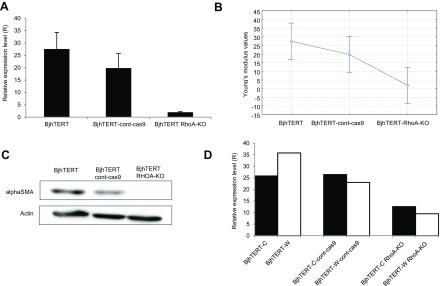
Changes in RNA and protein levels of α-SMA following CRISPR-Cas9–mediated RhoA gene KO in BjhTERT fibroblasts. (A) qRT-PCR for α-SMA expression in BjhTERT following CRISPR-Cas9–mediated RhoA gene KO in fibroblasts. y axis: expression levels of α-SMA gene normalized to levels of TBP reference gene. x axis: cDNA samples. Data are means with SD intervals, from three separate experiments. (B) Young's modulus from qPCR data. Data are means with 0.95 confidence intervals of the respective means. (C) Representative Western blotting of BjhTERT, BjhTERT–cont-cas9, and BjhTERT RhoA-KO fibroblasts, showing α-SMA protein levels in total cell lysates. Actin protein levels shown as the loading control. (D) qRT-PCR analysis of α-SMA expression in BjhTERT-C and BjhTERT-W fibroblasts following CRISPR-Cas9–mediated RhoA gene KO in fibroblasts. y axis: expression levels of α-SMA gene normalized to levels of TBP reference gene. x axis: the cDNA samples.

