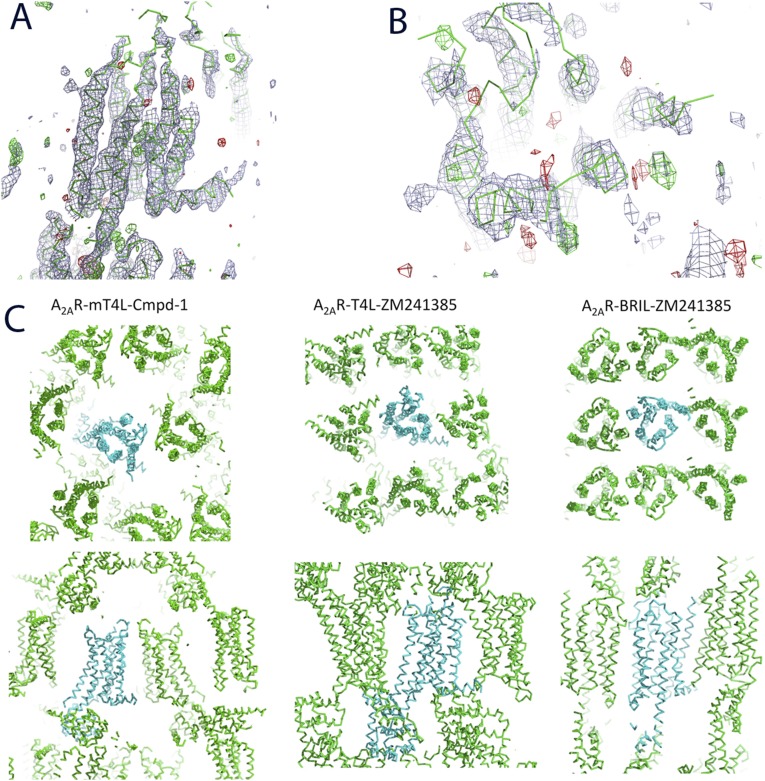
Fig. S1.
Electron density map and crystal packing of A2AR–mT4L–Cmpd-1 crystals grown in LCP. (A) Density map of A2AR–mT4L–Cmpd-1. 2Fo–Fc map is shown in gray mesh at 1.0 σ, and Fo–Fc map is shown in green (for positive peaks) and red (for negative peaks) mesh at 2.0 σ. (B) Close-up view of the potential ligand binding pocket. No density for side chains or the ligand was observed. (C) The crystal packing of A2AR–mT4L–Cmpd-1 (Left), A2AR–T4L–ZM241385 (Center), and A2AR–BRIL–ZM241385 (Right) shown in two orientations 90° apart. The center molecule is colored cyan, and surrounding molecules are colored green.

