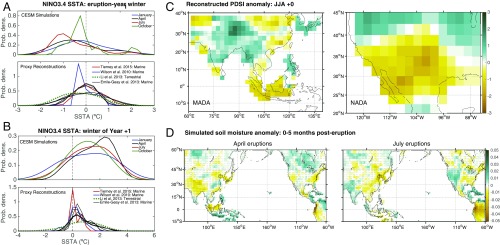
Fig. 3.
Comparison of CESM simulations against proxy reconstructions. (A) NINO3.4 SST anomaly during the winter of the eruption year for the CESM simulations [December–January–February (DJF); Top] and for several marine and terrestrially derived reconstructions (various definitions; Bottom). (B) Same as A, for the winter of the year following the eruption (Year +1). (C) Palmer Drought Severity Index anomaly for the boreal summer of the eruption year, derived from the Monsoon Asia Drought Atlas (32) (Left) and the North American Drought Atlas (33) (Right). (D) Zero- to 30-cm soil moisture anomaly averaged over the period 0–5 mo after the eruption, for CESM simulations with eruptions in April (Left) and July (Right). All CESM anomalies are computed relative to the 30 y before the eruption; in D, stippling indicates regions where the anomalies are insignificant relative to internal variability at 90% based on a Wilcoxon rank-sum test.

