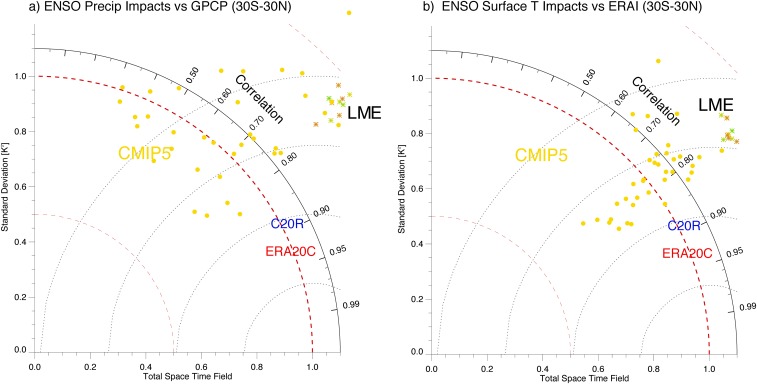
Fig. S1.
Taylor diagrams indicating the performance of the CESM LME for (A) ENSO-related precipitation anomalies compared with the Global Precipitation Climatology Project (GPCP) and (B) ENSO-related temperature anomalies compared with the European Center for Medium-Range Weather Forecasts reanalysis (ERA-Interim), both computed over the 30°S to 30°N region. Performance of the CESM is quite good compared with the majority of models included in the Coupled Model Intercomparison Project phase 5 (CMIP5), although there is excessive variance (roughly 30% increase) in the LME compared with observations.

