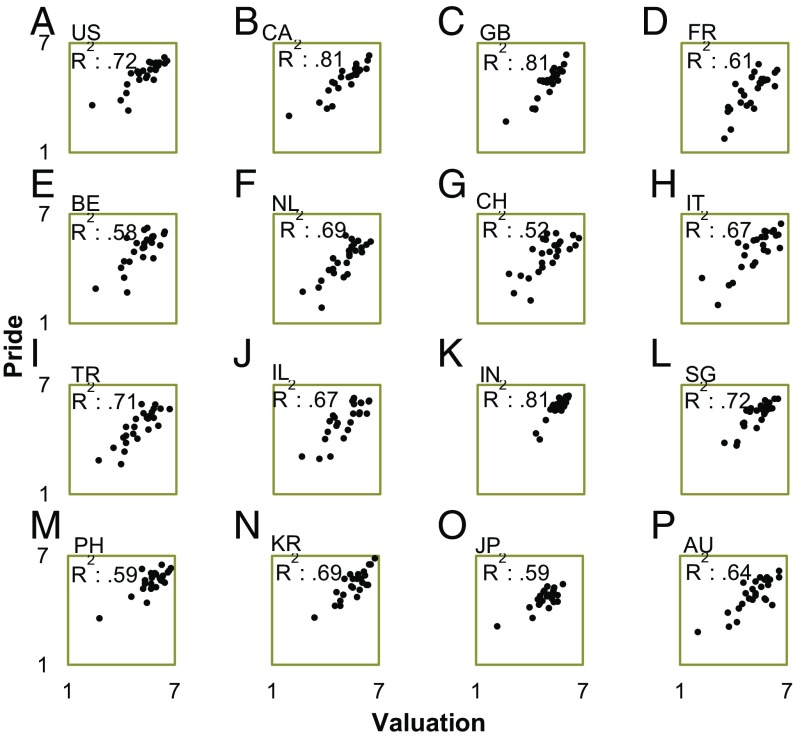
Fig. 1.
Studies 1a–1p. Scatter plots: pride as a function of valuation. Each point represents the mean valuation rating and mean pride rating of one scenario. Valuation and pride ratings were given by different participants (n = 25 scenarios; effect size: R2 linear). (A) United States (US). (B) Canada (CA). (C) United Kingdom (GB). (D) France (FR). (E) Belgium (BE). (F) The Netherlands (NL). (G) Switzerland (CH). (H) Italy (IT). (I) Turkey (TR). (J) Israel (IL). (K) India (IN). (L) Singapore (SG). (M) Philippines (PH). (N) South Korea (KR). (O) Japan (JP). (P) Australia (AU).

