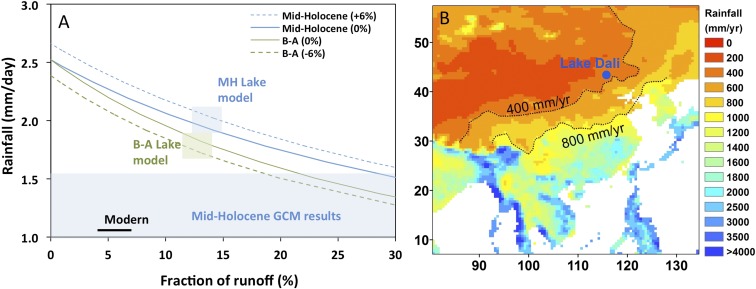
Fig. 4.
Rainfall reconstructions. (A) The Holocene humid period (blue lines) and B–A (green lines) hydrologic scenarios calculated using a combination of a closed-basin lake model with the Budyko relation between precipitation amount and runoff fraction (blue and green shaded squares). The solid lines are for no change in evaporation rate, and the dashed lines include changes in evaporation rate calculated using the Penman equation (SI Materials and Methods). The range of general circulation model (GCM) precipitation values for the Mid-Holocene humid period is shown in the shaded blue band (SI Materials and Methods; Table S5). The modern rainfall and fraction of runoff is shown for comparison (black line). (B) East Asian modern rainfall distribution (shaded) (data from the Global Precipitations Climatology Centre, www.esrl.noaa.gov/psd/data/gridded/data.gpcc.html). A doubling of rainfall during the Early and Middle Holocene (from 400 to 800 mm/y) requires an ∼400 km northward shift of the 800 mm isohyet.

