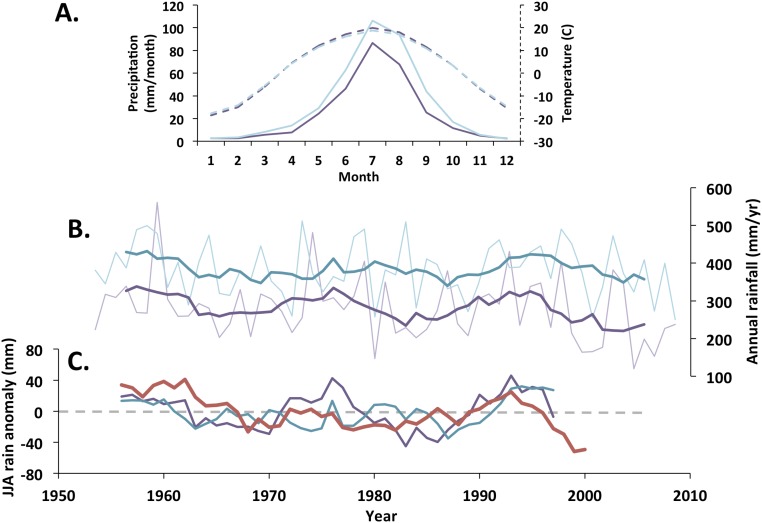
Fig. S1.
Lake Dali climatology. (A) The 48-y (1953–2000) monthly averages of precipitation (solid lines) and temperature (dashed lines) for Duolun (turquoise) and Xilinhot (purple) (47). (B) Time series of annual rainfall (thin lines) and 7 y smooth (thick lines) for Duolun (turquoise) and Xilinhot (purple) (47, 48), and (C) 7-y smoothed JJA rainfall anomaly for north China (33) (red), Duolun (turquoise), and Xilinhot (purple), calculated from 1971 to 2000 average to compare with north China anomaly (33).

