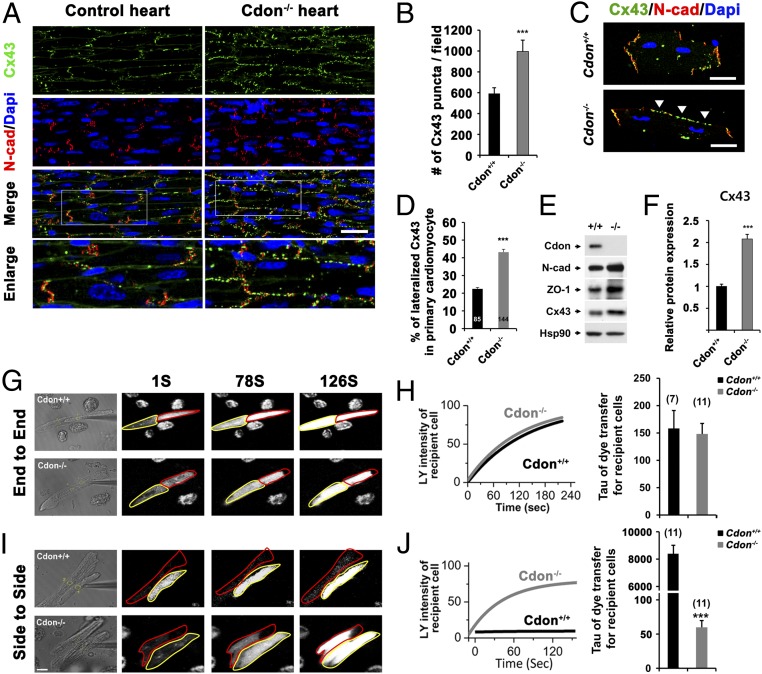
Fig. 4.
Cdon deficiency causes alterations in Cx43 levels and localization. (A) Immunostaining of Cdon+/+ and Cdon−/− hearts for Cx43 (green) and N-cad (red) as a marker of the ID. (Scale bar, 50 μm.) Boxed areas are enlarged in the Lower panels. (B) Quantificational analysis for Cx43 puncta in A. (n = 6) ***P = 0.005. (C) Representative immunostaining images of isolated Cdon+/+ or Cdon−/− primary cardiomyocytes for Cx43 and N-cad. (Scale bar, 20 μm.) Arrowheads indicate lateralized Cx43. (D) Quantification of lateralized Cx43 in C. n = 85 for Cdon+/+, n = 144 for Cdon−/− cells. ***P < 0.001. (E and F) Western blot analysis for the expression of cardiac intercalated disc proteins in Cdon+/+ and Cdon−/− hearts. HSP90 was used as a loading control. Cdon−/− hearts exhibit twofold increased Cx43 protein level compared with control heart. ***P < 0.005. n = 3. (G–J, Left) Measurement of Lucifer yellow (LY) dye flux in end-to-end (G) or side-to-side cell pairs (I) and subsequent LY dye transfer from a single injected cell to a recipient cell in Cdon+/+ and Cdon−/− cardiomyocytes at 1, 78, and 126 s. Donor cells and recipient cells were marked with a yellow or red line, respectively. Representative regions of interest used to quantify the LY fluorescence are shown in the phase contrast image. (H and J) Representative fitted single time courses of light intensity in recipient cell from cell pairs and summarized τ data of LY transfer in recipient cell from each cell pair shown in G and I, respectively. Note that the time constant (τ, time to reach ∼63% peak) for end-to-end coupling was 158.28 ± 32.70 (n = 7) in WT and 146.6 ± 38.86 (n = 11) in Cdon−/− myocytes (NS). τ for the side-to-side coupling, which was 6,957 ± 997.27 (n = 11) in WT, significantly reduced to 56.60 ± 5.0 in Cdon−/− myocytes (n = 11, ***P < 0.005). [Scale bar (Lower Left) 20 μm.] All experiments in this figure were repeated three times with similar results.

