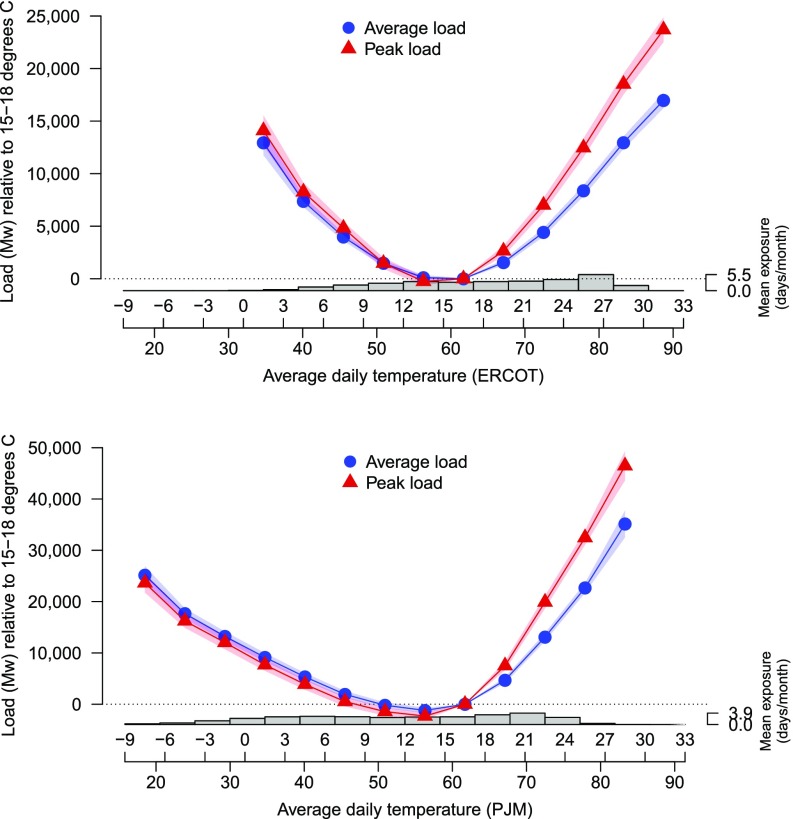
Fig. 1.
Daily electricity temperature response functions, average (total hourly load/24) (blue) and peak (max hourly load) (red). Each point estimate represents the effect of replacing a day with average temperature in the omitted category (15 °C to 18 °C) with a day of the relevant average temperature. Regressions use as controls: precipitation, day of week fixed effects, month of year fixed effects, and a sixth-order Chebychev polynomial in time. The 95th percentile confidence intervals are estimated using Newey–West standard errors. ERCOT (Top, relatively warm) and PJM (Bottom, relatively cold) are the two largest ISOs in the data. Histograms at the bottom of each panel display the average number of days per month in each temperature bin.

