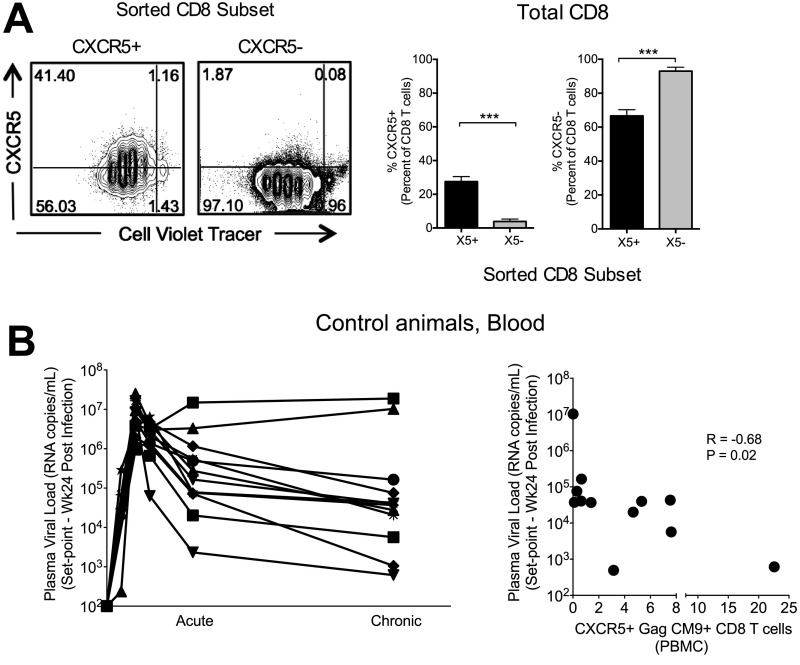
Fig. S5.
(A) Representative FACS plots showing CXCR5 expression on purified total CXCR5+ or CXCR5– CD8 T cells following a 5-d proliferation assay with anti-CD3 and anti-CD28 antibodies (Left) and the frequency of CXCR5+ and CXCR5– CD8 T cells (% of CD8) (Right). (B) Temporal plasma VL (Left) and association between set point viremia and CXCR5 expression on SIV Gag CM9 tetramer+ CD8 T cells in blood at week 24 postinfection (chronic) in a group of unvaccinated SIV251-infected rhesus macaques. ***P < 0.001.

