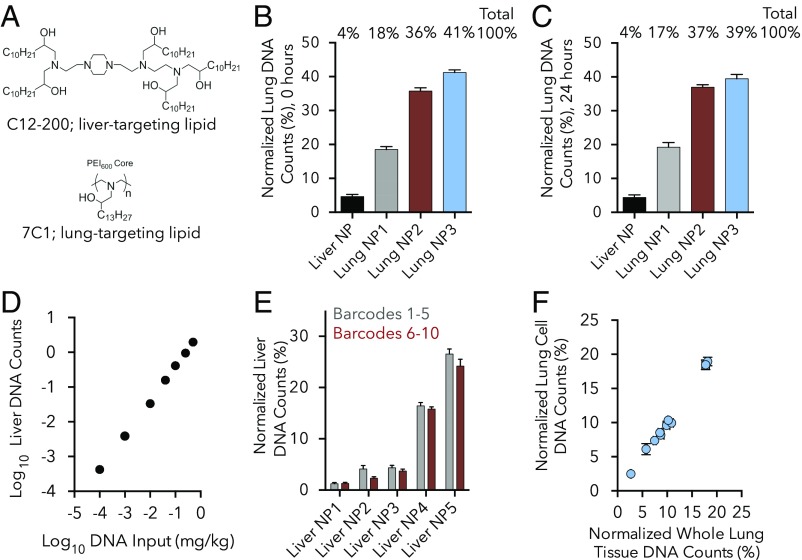
Fig. 2.
DNA barcoded nanoparticle data are robust. (A) Nanoparticle (NP) biodistribution using 7C1 and C12-200, two well-validated NPs with known activity in the lung and liver, respectively. (B) Normalized DNA barcode counts in the lung 4 h after the administration of the liver-targeting C12-200 or three different formulations of the lung-targeting 7C1. Normalization technique used for all “normalized” figures is described in Materials and Methods. n = 4 mice/group. (C) Normalized DNA barcode counts in the lungs 4 h after administration of the same four-nanoparticle solution in B. In this case, the particles were administered the next day, after being allowed to mix for 24 h. No change in targeting was observed between the “freshly injected” and “24 h mixed” particles. n = 4 mice/group. (D) DNA barcode counts in the liver 4 h after administration of an “in vivo standard curve.” The same C12-200 nanoparticle formulation was made seven separate times with seven different barcodes. These solutions were mixed together at different doses (DNA inputs) to form an in vivo standard curve. DNA readouts align with this DNA input at doses between 0.0001 and 0.5 mg/kg DNA barcode. n = 5 mice/group. (E) Normalized DNA barcode counts in liver 4 h after administration of different DNA sequences. Five different C12-200 NPs were formulated twice, each with a different barcode. Delivery for each of the five NPs did not change with barcode sequence. n = 5 mice/group. (F) DNA barcode counts in the lung 4 h after 10 different 7C1 NPs were injected. Sequencing was performed on either whole-lung tissue or lung cells isolated isolated from the same lung by flow cytometry. The delivery of all 10 particles was the same for whole tissue and isolated cells. n = 4 mice/group. For all data presented in this figure, the detailed NP formulation parameters are listed in SI Appendix, Fig. S2, and the data are plotted as average ± SD.

