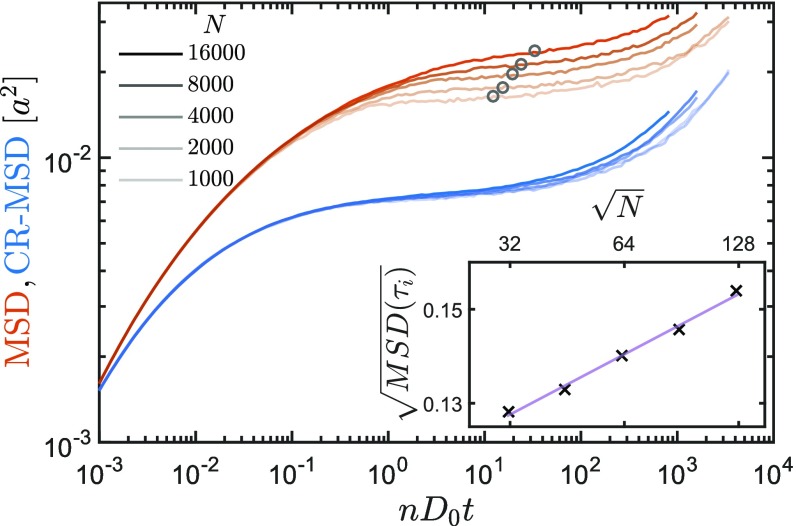
Fig. 4.
MSD and CR-MSD of a hard disk system for various system sizes at for up to 16,000 particles. Although the CR-MSD (blue) does not show finite size effects in the plateau, the standard MSD (red) is strongly affected. Increasing opacity of the curves corresponds to increasing size. A total of independent simulations were performed for each curve (except for with runs). Inset shows the linear amplitude of the fluctuations vs. system size in log-lin scale. is given by the inflection point of the curves, marked as gray circles. The straight line is a linear fit of the log10(L) behavior and verifies Mermin–Wagner fluctuations in 2D amorphous solids.

