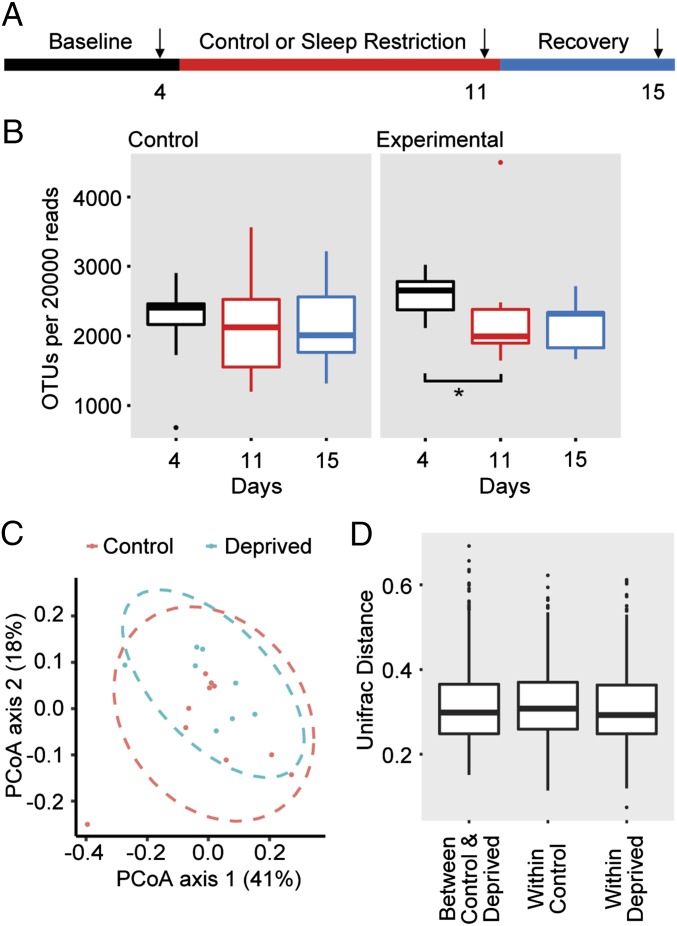
Fig. 1.
Rat microbiome maintains overall composition following sleep restriction. (A) Schematic of experimental design. Arrows indicate the days on which the fecal pellets were collected for analysis. DNA was collected from rat feces and analyzed by V1-V2 rRNA sequencing. (B) Box-and-whiskers plots of OTUs per 20,000 reads sequenced. n = 10 for the controls, n = 8 for sleep-restricted. *P < 0.05 using paired Student’s t test. (C) PCoA plots explaining 41% and 18% of the variance of OTUs adjusted for abundance of control and sleep-restricted rats at day 11. (D) Box-and-whiskers plots of Unifrac distances comparing control and deprived at day 11 “between control & deprived,” control day 4 to day 11 “within control,” and deprived day 4 to day 11 “within deprived.”

