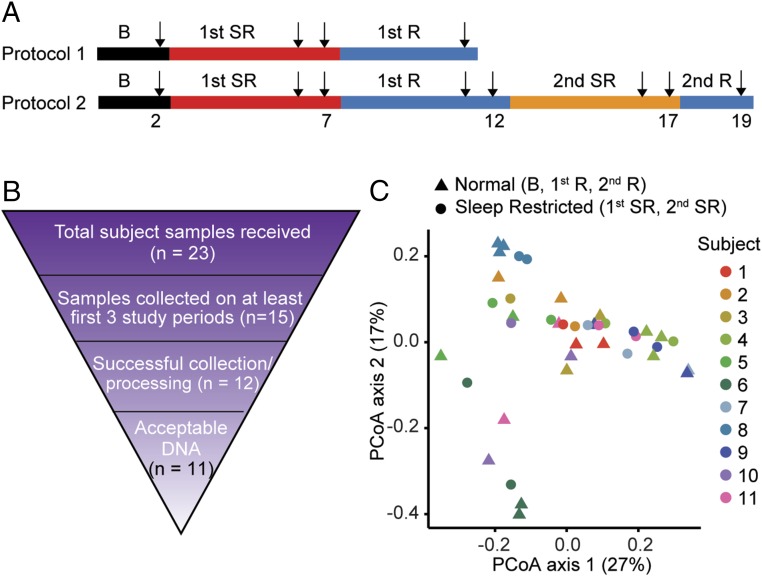
Fig. 3.
Large variations in the microbiome of individual humans. (A) Schematic of experimental design. Arrows indicate the days on which the samples were collected for analysis. (B) Rationale for final subject exclusion or selection in microbiome analysis. DNA was collected from human feces and analyzed by V1-V2 rRNA sequencing. (C) PCoA plots explaining 27% and 17% of the variance of weighted UniFrac distances from individual subjects.

