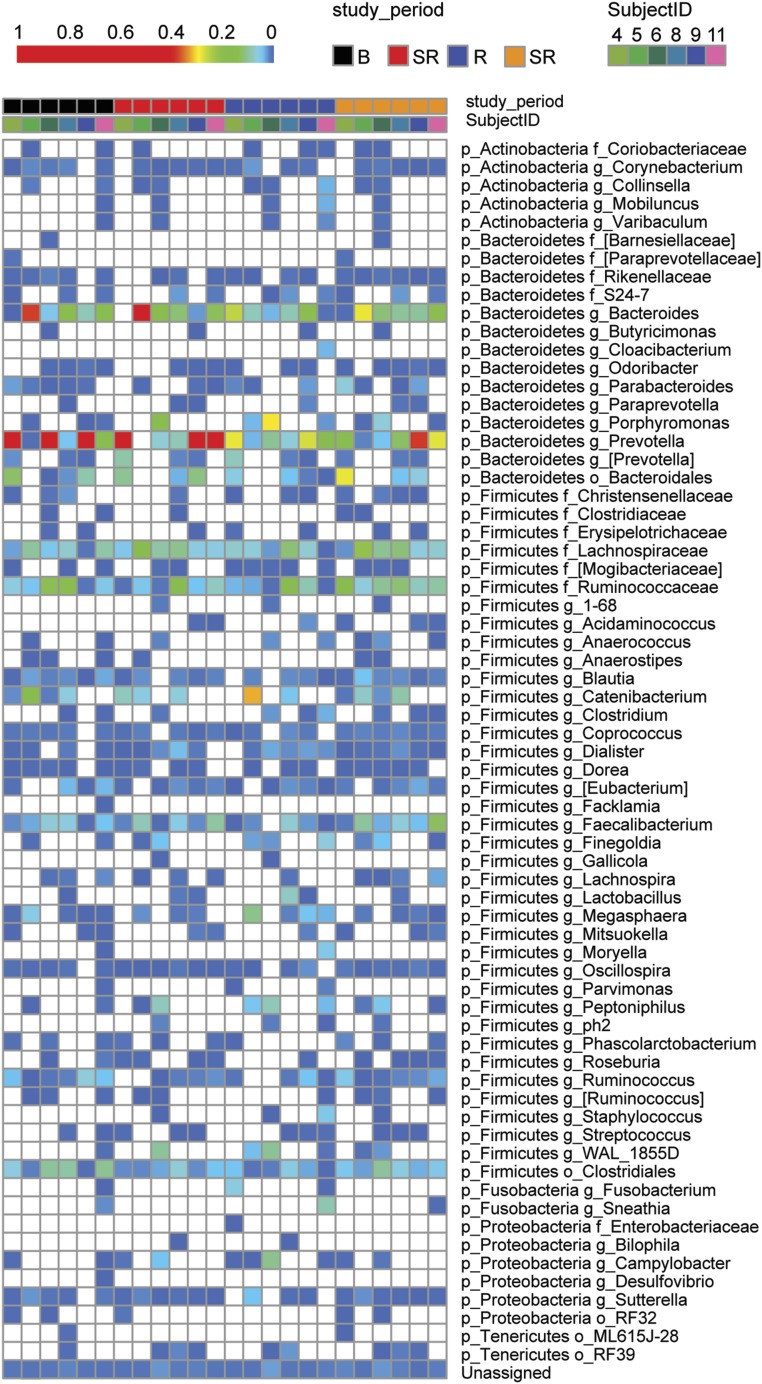
Fig. 5.
Individual OTUs of human microbiome do not exhibit large shifts following sleep deprivation. Heat map from individual human samples at baseline, after sleep restriction, after recovery, after the second round of sleep restriction. Blue to red gradient indicates low to high relative levels of OTUs within the given taxonomic unit. White spaces indicate that no reads were observed.

