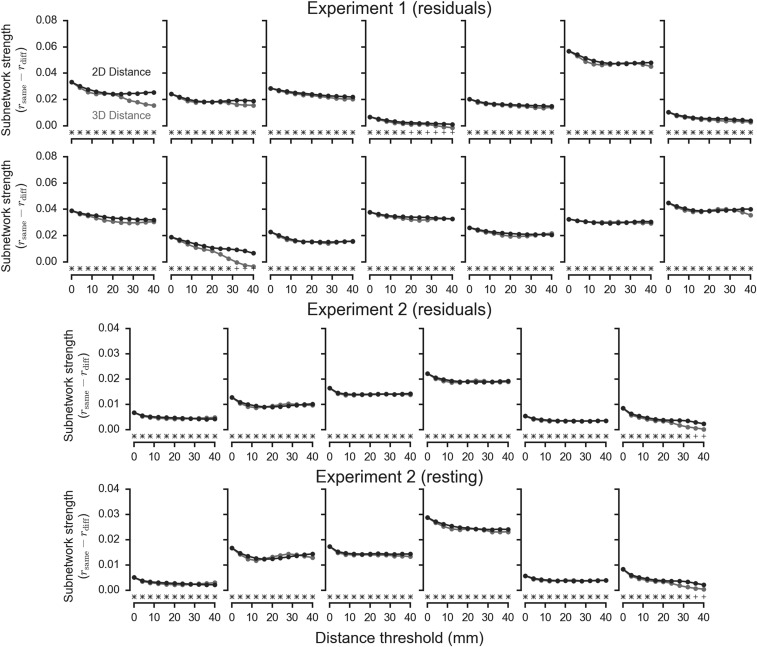
Fig. S8.
Subnetworks extend over relatively long distances. Lines show the difference between mean same context and different context time series correlations computed while excluding pairs of voxels that are more proximal than the specified distance threshold. Distances were computed in two dimensions (along the cortical surface) and in three dimensions (in the imaging volume). Significant differences at P < 0.05, as determined using a permutation test, are shown for 2D analyses using a + and for 3D analyses using a ×. Each plot shows data from one subject, and subjects are ordered by decoding accuracy.

