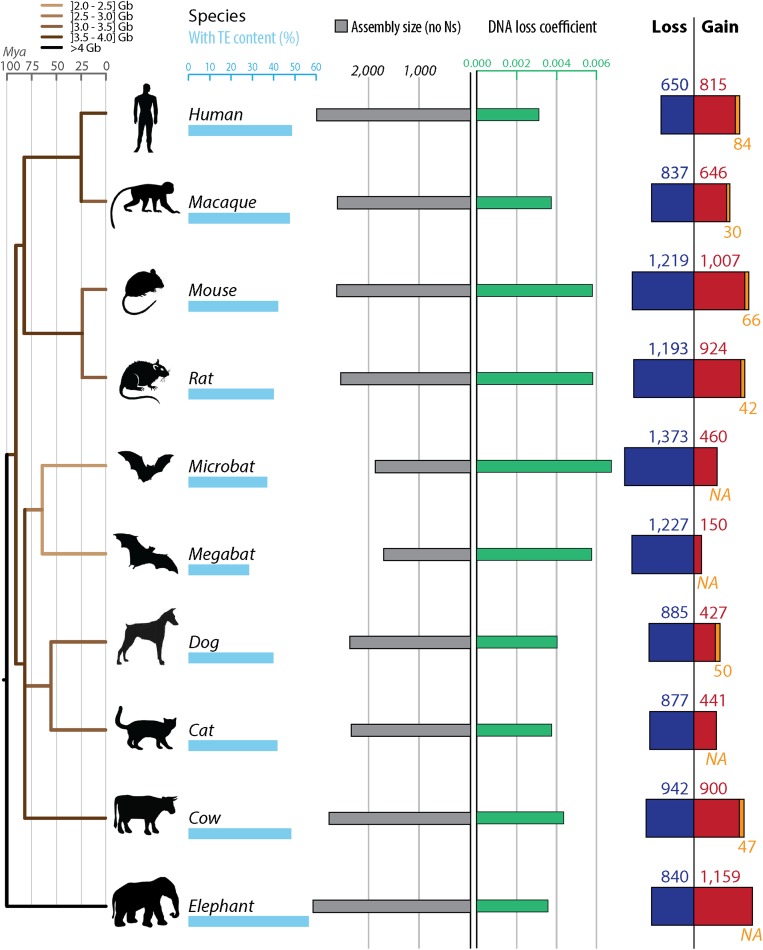
Fig. 2.
Gain and loss of DNA in 10 mammalian lineages. For each species, phylogenetic relationship (Left) (34), TE content (light blue bars), assembly sizes (with N removed, gray bars), DNA loss coefficients (green bars), as well as gain (red and orange) and loss (dark blue) of DNA are shown. DNA gains correspond mostly to lineage-specific TEs in red (not shared with other mammals). When available, measures of segmental duplications were added (orange). Because segmental duplications also contain TEs, we corrected the segmental duplication amounts with the TE content of each genomes. DNA loss amounts and coefficients are calculated as in ref. 39 using a common ancestor “assembly” size for all mammals of 2,800 Mb (Methods). The phylogenetic tree is color-coded based on genome sizes in gigabases (data in picograms from ref. 32) based on parsimony. See Dataset S2 for numbers, calculation steps and assemblies details. All numbers are in megabases.

