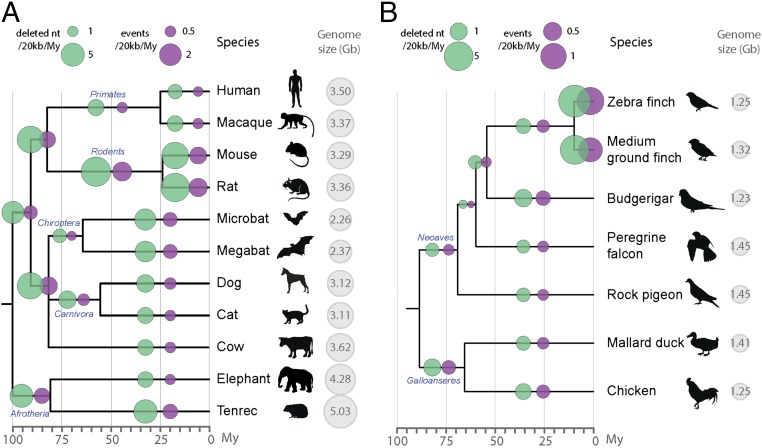
Fig. 5.
Microdeletion rates across amniotes. Microdeletion (1–30 bp) rates and number of events are shown in green and purple, respectively. Microdeletions are estimated from gaps in the UCSC MultiZ 100-species alignment of human chromosomes 1–22, restricted to blocks containing information for the species studied (Methods and Dataset S3). Deletion rates are calculated by dividing the amount of gaps specific to each branch (not present in any other species) by millions of years of each branch. Cytological haploid genome sizes are from ref. 32. There were no reported genome sizes for two species, so the size of the closest species is shown: the Tenrecidae Setifer setosus for E. telfairi and the average of two birds of the same family (Emberizidae) for the medium ground finch. Scales are indicated on top (note the difference between A and B). (A) Microdeletion rates in 11 placental mammals (with M. domestica as outgroup). The total length of the alignment is 297 Mb and timescales are as in refs. 34, 37, 60, and 61. Names of orders are indicated on the tree (in blue). (B) Microdeletion rates in seven birds (with A. carolinensis as outgroup). The total length of the alignment is 66.5 Mb. Timescales are from ref. 55. Names of two superorders are placed on the tree (in blue).

