Fig. 3.
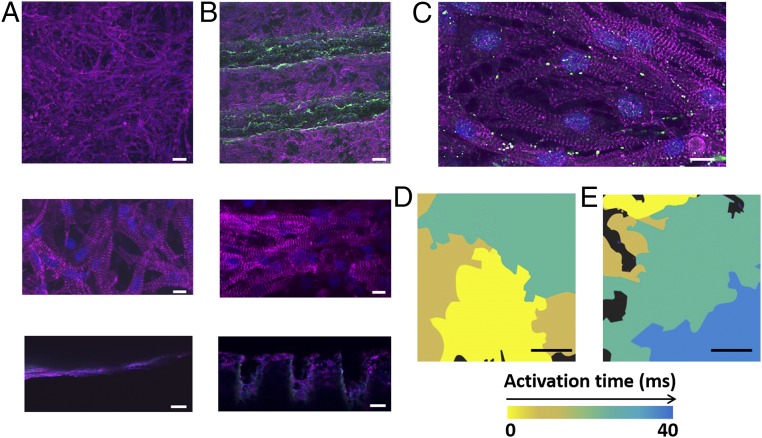
Cardiac tissue organization and function. (A and B) Immunofluorescence images of α-sarcomeric actinin (pink) in cardiomyocytes cultured within planar (A) and grooved (B) scaffolds. Cell nuclei are shown in blue. Bottom panels show side views of the tissue constructs. (C) Connexin 43 molecules (green) are found between adjacent cells, indicating on their electrical coupling. (D and E) Heat maps showing randomly oriented electrical signal propagation of an engineered cardiac tissue within the planar scaffolds (D) and anisotropic propagation within the grooved scaffolds (E). (Scale bars: 50 μm in A and B, Top and A and B, Bottom; 50 μm in A and B, Middle; 10 μm in C; 500 μm in D and E.)

