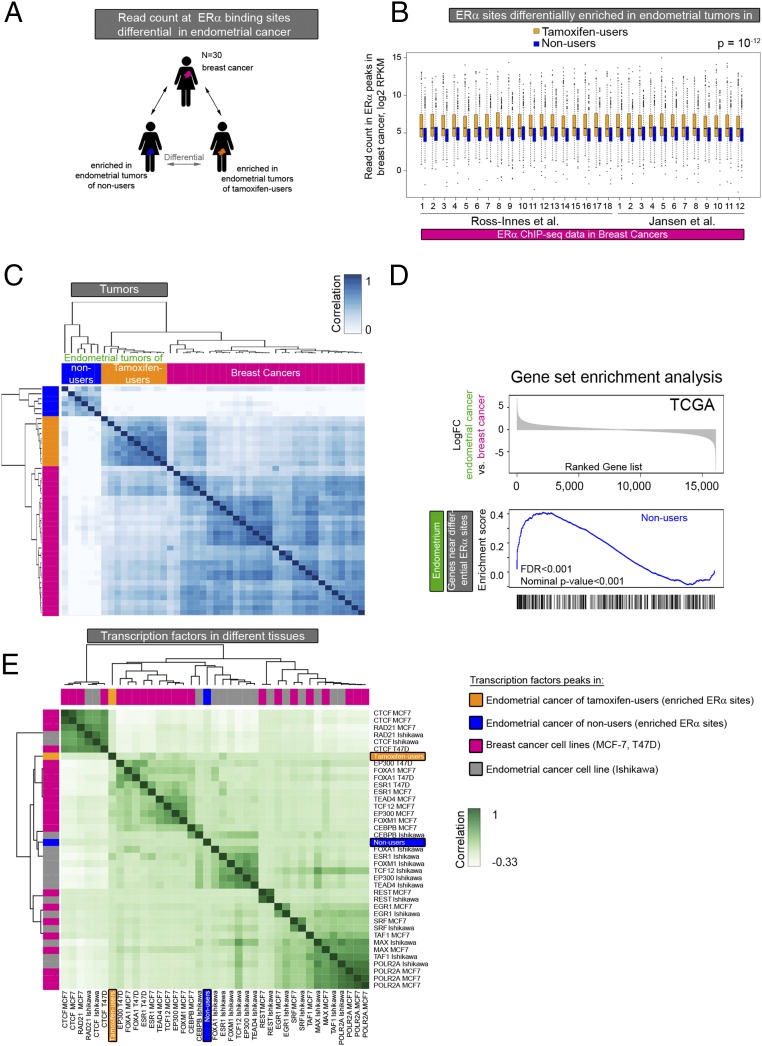
Fig. 4.
Comparative analysis of ERα-binding sites in endometrial and breast tumor tissue. (A) Analysis set-up. ERα binding in breast cancer at the differential sites in the two endometrial cancer groups was evaluated. (B) Boxplot showing the normalized ERα ChIP-seq read count in breast cancers at the ERα-binding sites differentially enriched in endometrial tumors from tamoxifen users (orange boxplots) and nonusers (blue boxplots). The P value of the paired t test is P = 10−12. (C) Heatmap visualization of the correlation matrix based on ERα ChIP-seq read count at differential ERα-binding sites in endometrial tumors of tamoxifen users (orange) and nonusers (blue) and in breast tumors (pink). (D) GSEA based on differential gene expression in endometrial and breast cancers from the TCGA pan-cancer project. (Upper) Ranked log-fold change in gene expression in endometrial cancer vs. breast cancer. (Lower) Enrichment scores vs. gene rank in the significantly enriched gene set: genes proximal to the binding sites enriched in tumors of nonusers. (E) Hierarchical clustering of the correlation between transcription factor genomic occupancy (peaks) from publicly available ChIP-seq data in the breast cancer cell lines MCF-7 and T47D (pink), the endometrial cancer cell line Ishikawa (gray), and the ERα sites enriched in endometrial tumors from tamoxifen users (orange) and nonusers (blue).

