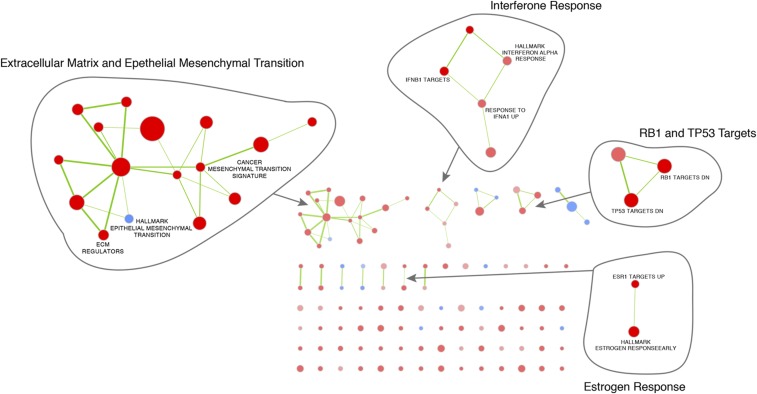
Fig. S7.
The networks illustrate the results of the pathway enrichment analysis (with GSEA) of differential gene expression in tamoxifen users and nonusers. Nodes represent pathways that link overlapping genes (overlap coefficient cutoff 0.5). Red nodes illustrate pathways up-regulated in tamoxifen users, and blue nodes represent pathways up-regulated in nonusers.

