Fig. 4.
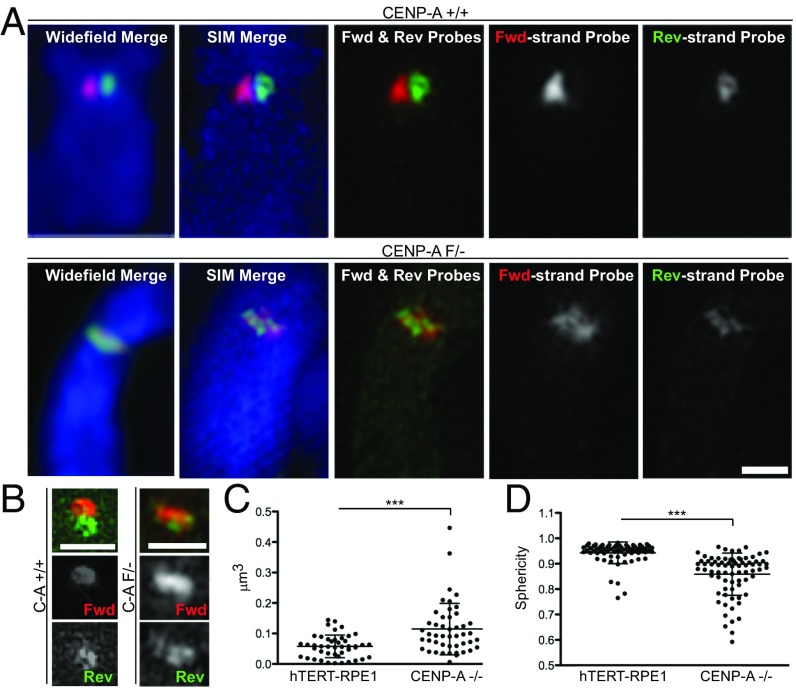
Superresolution imaging of centromeric CO-FISH in CENP-A knockout cells. (A) Conventional deconvolution microscopy (Left) and 3D-SIM images of the same chromosome stained by c-CO-FISH (probe set 1) in human hTERT-RPE1 (Top) or CENP-A knockout cells (Bottom). (B) A 3D-SIM example of centromeres in hTERT-RPE1 (C-A; CENP-A+/+) or CENP-A knockout (C-A−/−). (Scale bars, 1 μm.) (C) Volume and (D) sphericity in cells as in A. Error bars ± SD, ***P ≤ 0.0005. Plotted are single centromeres, calculated using the green reverse-strand probe fluorescence.

