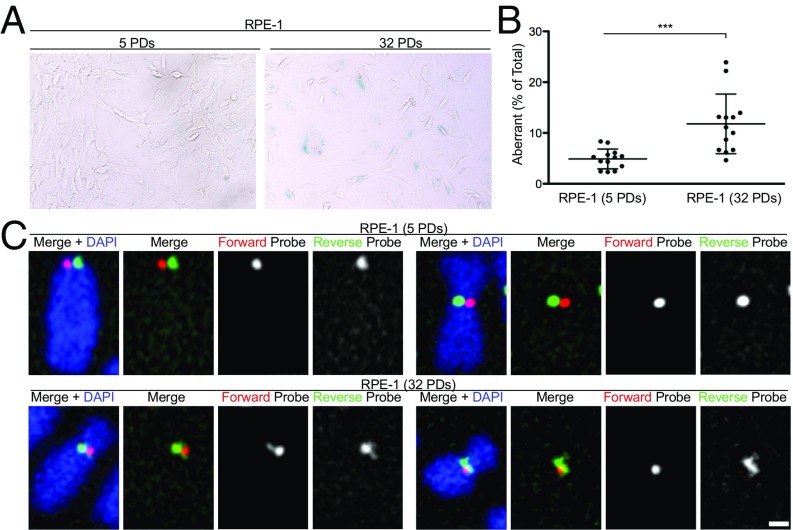
Fig. 5.
Senescence-associated centromere instability in RPE1 cells. (A) Senescence-associated β-galactosidase staining in RPE1 cells at different population doublings (PDs): young (5 PDs) versus old (32 PDs). (B) Quantification of aberrant c-CO-FISH patterns. Error bars ± SD, ***P ≤ 0.0005. (C) c-CO-FISH examples of normal c-CO-FISH pattern (Top) using probe 1 found in young cells and aberrant patterns (Bottom) seen in presenescence cells in old RPE1.

