Fig. 6.
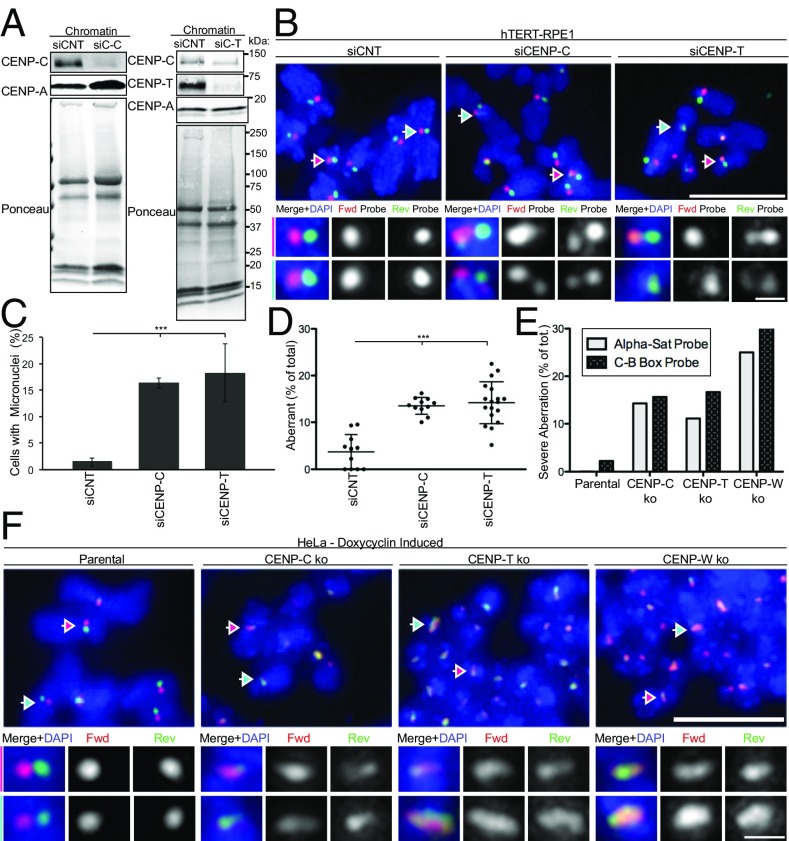
CCAN components CENP-C and CENP-T/W contribute to centromere stability. (A) hTERT-RPE1 cells were treated with control siRNA (siCNT) or siRNA targeting to CENP-C and CENP-T for 72 h, Left and Right, respectively. Western blotting using antibodies as indicated and ponceau staining of chromatin. Molecular weights (in kilodaltons) are indicated. (B) Representative c-CO-FISH images upon CENP-C and CENP-T RNAi. (Scale bar, 5 μm.) Colored arrows indicate the centromeres that were zoomed in and the channels separated in the tiles below. (Scale bar, 0.5 μm.) (C) Quantification of micronuclei in cells as in A. Error bars ± SD, ***P ≤ 0.0005. (D) Quantification of aberrant centromeres. n ≥ 10. Error bars ± SD, **P ≤ 0.005. (E) Inducible knockout HeLa cells with Cas9 under control of a stably integrated Tet-On promoter. Doxycycline was added for 5 d for CENP-C and CENP-T knockouts and 3 d for CENP-W knockout. Cells were then harvested for c-CO-FISH and quantified for the percentage of metaphases where more than 80% of chromosomes show aberrant c-CO-FISH pattern. n = 40. (F) Examples of parental HeLa and CENP-C, CENP-T, and CENP-W knockouts showing the severe c-CO-FISH aberrations quantified in E. (Scale bar, 5 μm.) Colored arrows indicate the centromeres that were zoomed in and the channels separated in the tiles Below. (Scale bar, 0.5 μm.)

