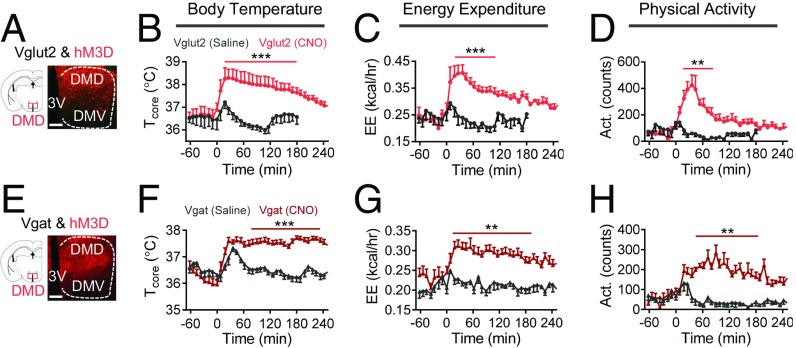
Fig. 4.
Activation of DMD neurons increases body temperature. (A) Schematic and representative images of viral expression of hM3D in DMD Vglut2-IRES-Cre+ neurons. (B–D) Activation of DMDVgut2 neurons (n = 5) by CNO injection (i.p. at t = 0, 1.5 mg/kg body weight) resulted in significant increases in Tcore (B), EE (C), and activity (D). (E) Schematic and representative images of viral expression of hM3D in DMD Vgat-IRES-Cre+ neurons. (F–H) Activation of DMDVgat neurons (n = 8) by CNO injection (i.p. at t = 0, 1.5 mg/kg body weight) resulted in significant increases in Tcore (F), EE (G), and activity (H). (Scale bars: 100 μm.) All data are plotted as mean ± SEM. The P values, compared with the saline group, are calculated based on statistical tests listed in SI Appendix, Table S1. **P ≤ 0.01; ***P ≤ 0.001.

