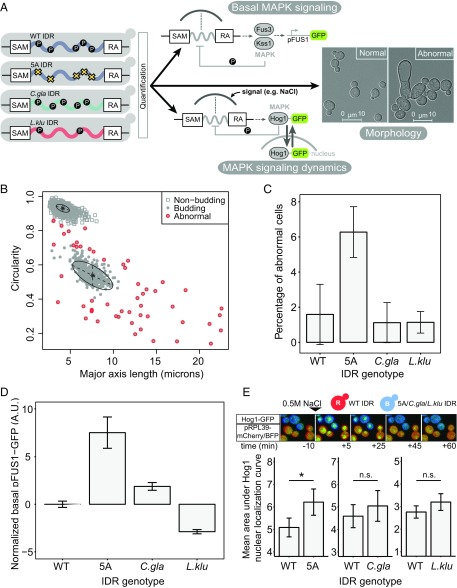
Fig. 2.
Diverged orthologous IDRs recapitulate S. cerevisiae IDR functions compared with the 5A mutant. (A) Diverged IDRs were swapped with the S. cerevisiae IDR, and three different functional outputs were quantified: morphology, basal MAPK (Fus3) signaling, and MAPK (Hog1) signaling dynamics. (B) Cell morphology clusters along two dimensions. Each point represents one cell for which major axis length and circularity features were extracted. Figure shows example plot from one biological replicate, where cells have been classified as nonbudding, budding, and abnormal (Materials and Methods for details). (C) Average percentage of cells with abnormal morphology for each IDR genotype. Error bars represent 1.96 SE between three biological replicates (average of ∼400 cells per replicate). (D) Diverged IDRs mostly recapitulate wild-type basal pFUS1-GFP levels. Error bars represent 1.96 SE between 6 to 12 biological replicates (50,000 cells per replicate) for each strain. (E, Top) Representative images of time-lapse movies capturing Hog1-GFP localization in cocultured wild-type and experimental strains (constitutively expressing mCherry and mTagBFP2, respectively). (Bottom) Diverged IDRs recapitulate wild-type Hog1 signaling dynamics. Error bars represent 1.96 SE. Asterisk represents statistical significance (P < 0.01, Student’s t test, n = 15–35 cells) while n.s. indicates no statistical significance (P > 0.05, Student's t test, n = 15–35 cells).

