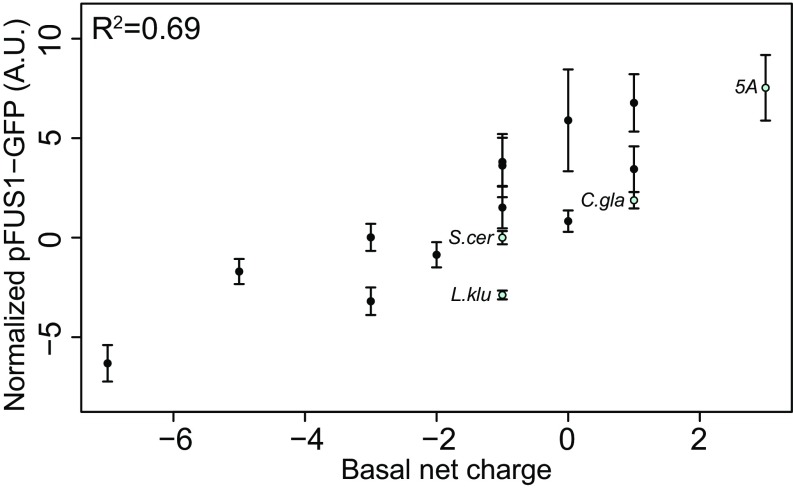
Fig. 4.
Basal net charge and MAPK reporter pFUS1-GFP expression are positively correlated. Each point represents a different IDR genotype (with blue corresponding to previously shown orthologous IDRs, the wild-type S. cerevisiae IDR, and the 5A IDR mutant, and black corresponding to engineered IDRs with varying phosphorylatable residues, charge, and length). Error bars represent 1.96 SE.

