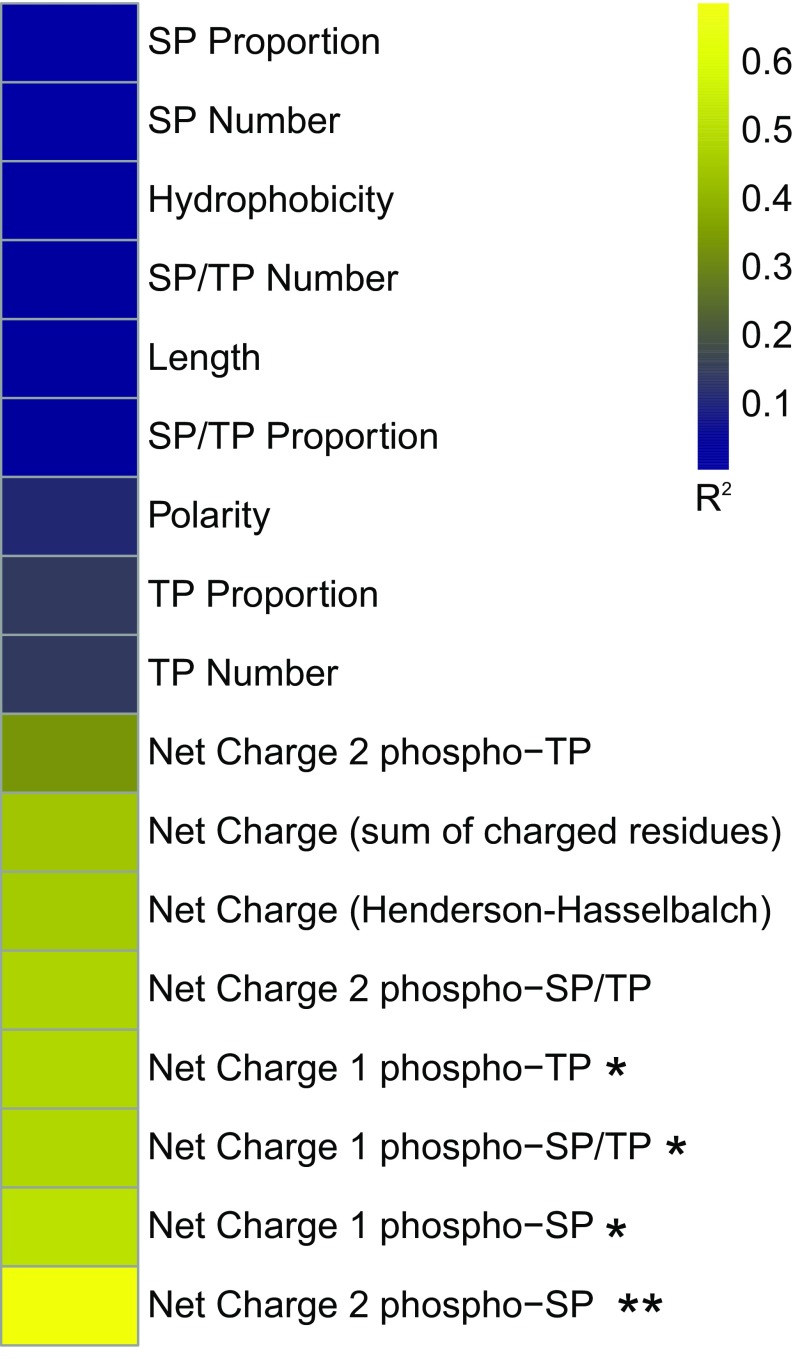
Fig. S5.
Heat map of sequence features correlated with functional output (pFUS1-GFP expression) of the Ste50 IDRs tested. *P < 0.05 Bonferroni-corrected, **P < 0.01 Bonferroni-corrected. In order of appearance in the figure: SP proportion refers to the number of SP phosphorylation consensus motifs divided by the total number of amino acids in the IDR; SP number refers to number of SP phosphorylation sites regardless of IDR length; hydrophobicity refers to the GRAVY (grand average of hydropathy) index score of each IDR; SP/TP number is the number of SP or TP phosphorylation consensus motifs in the IDR; length is the total number of amino acid residues in the IDR; SP/TP proportion is the number of SP or TP phosphorylation consensus motifs divided by the total number of amino acids in the IDR; polarity is the average polarity score of the IDR; TP proportion is the number of TP consensus phosphorylation sites divided by the total number of amino acids in the IDR; TP number is the total number of TP consensus phosphorylation sites in the IDR; net charge (sum of charged residues) is the number of positively charged residues in the IDR minus the number of negatively charged residues in the IDR; net charge (Henderson–Hasselbach) is the net charge of the IDR as calculated by the Henderson–Hasselbalch equation at pH 7 and pKa determined by the Lehninger scale; net charge 1 or 2 phospho-SP or TP or SP/TP refers to the net charge (sum of charged residues) in the IDR with the potential for basal phosphorylation of one or two SP, TP, or SP/TP phosphorylation consensus motifs (see Materials and Methods for more details on calculations).

