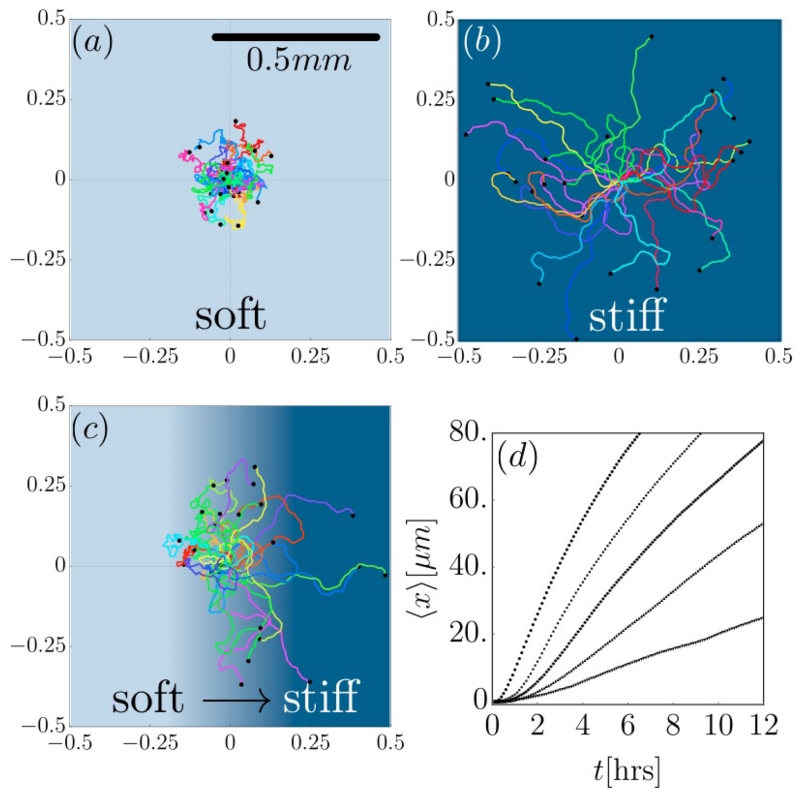
FIG. 1. Persistence-dependent motility.
Simulated trajectories of 25 cells, departing from the origin at t = 0 with a linear velocity of 50 μm/hr. Total time is 12 hrs, cellular positions are recorded at 6-minute intervals. A black dot marks the end of each cell trajectory. (a) Cells on a soft substrate, with a low persistence time τp = 0.2 hrs. (b) stiff substrate; persistence time τp =2 hrs. (c) Gradient substrate, with persistence time increasing linearly from 0.2 to 2 over the x-range [−0.1, 0.1] mm (i.e., Δτp/Δx = 9 hrs/mm). (d) averaged x-displacement in in the gradient, for different gradient steepnesses (top to bottom: Δτp/Δx = 90 hrs/mm, 18 hrs/mm, 9 hrs/mm, 4.5 hrs/mm, 1.8 hrs/mm).

