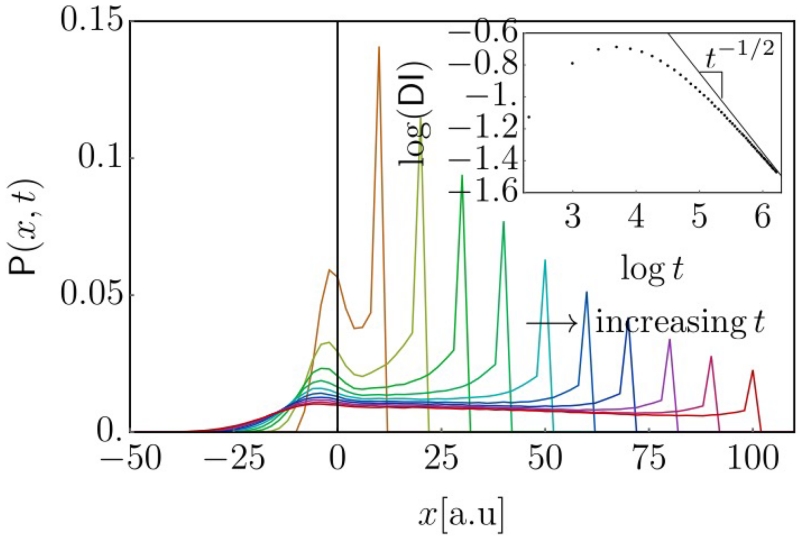
FIG. 4. Evolution of 1D inhomogeneous telegraph probability.
Probability distributions P(x, t) determined by direct integration of Eq. 5. The turning probability λ(x) decreased linearly from 0.4 to 0.02 over the x-interval [−5, 5]. From left to right, we plot distributions for t = 10 … 100 with 10 unit time intervals. Clearly visible is the diffusive spreading on the left, vs. the wave-like propagation to the right. The inset shows the long-time t−1/2 behavior of DI(t).

