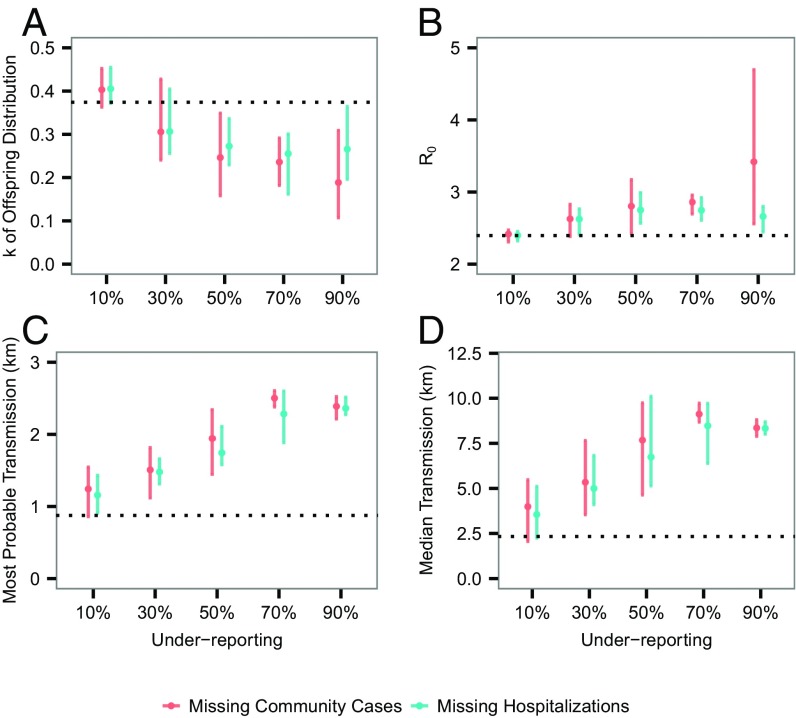
Fig. 5.
Effect of constant underreporting rates on estimates of transmission dynamics. (A) Estimates of . Bars represent the 95% C.I., and dots represent the median values. (B) Estimates of . (C) Estimates of most probable distance of transmission. (D) Estimates of median transmission distance. Dotted lines represent the corresponding estimates using our data. At each underreporting rate, 10 independent simulations and corresponding inference were performed (Materials and Methods).

