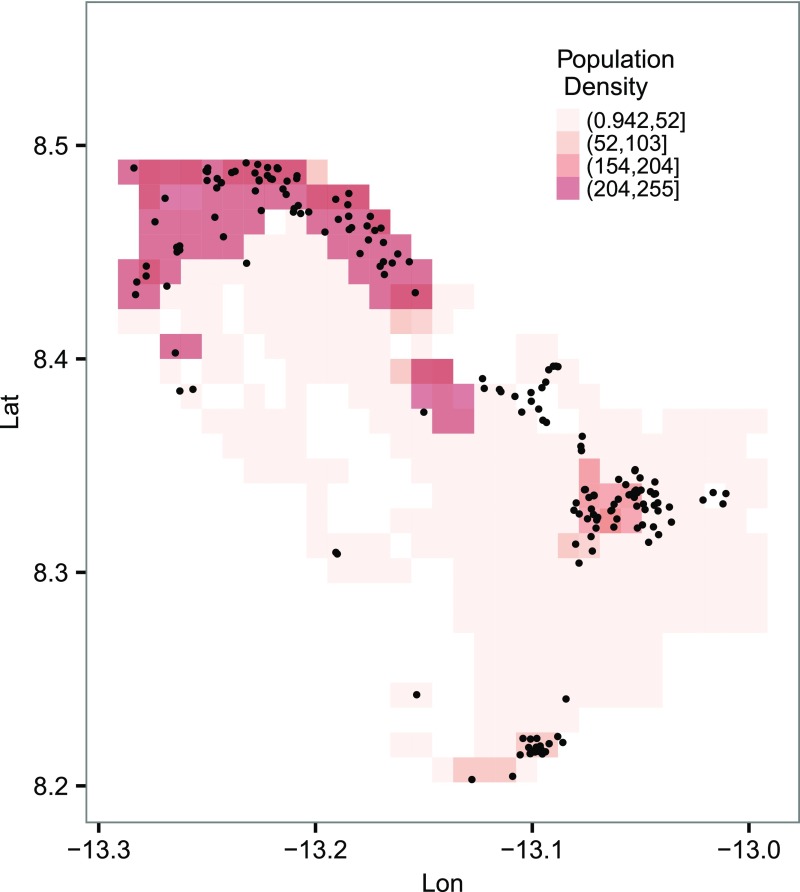
Fig. S3.
Population density and spatial distribution of the cases in the study area. Other than the smaller clusters near the center of the study area, most cases were found in more populated regions. It was noted that the raw grid resolution is (which is too fine to display), and here it is binned into grids for better visualization. Lat, latitude; Lon, longitude.

