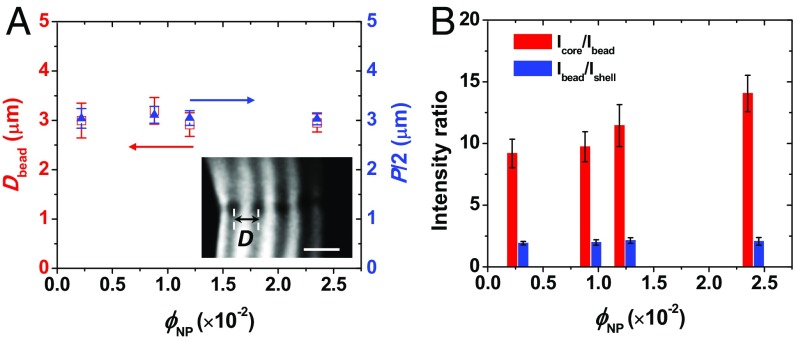
Fig. 3.
Properties of the arrays of beads in Ch-CNC droplets. (A) Variation of half-pitch, P/2, of the Ch shells (blue triangles) and the interbead spacing, D, in the disclination (red open squares), both plotted as a function of ϕNP. (Inset) Enlarged POM image of the fragment of bead array in the Ch-CNC shell at ϕNP = 2.35 × 10⁻². (Scale bar, 5 μm.) (B) Variation in the ratios of core-to-bead and bead-to-shell fluorescence intensities, plotted as a function of ϕNP in the Ch-CNC droplets. ϕ0= 4.5 × 10⁻². In A and B, for each value of ϕNP, at least 30 droplets were analyzed. The error bars in A and B represent the SDs.

