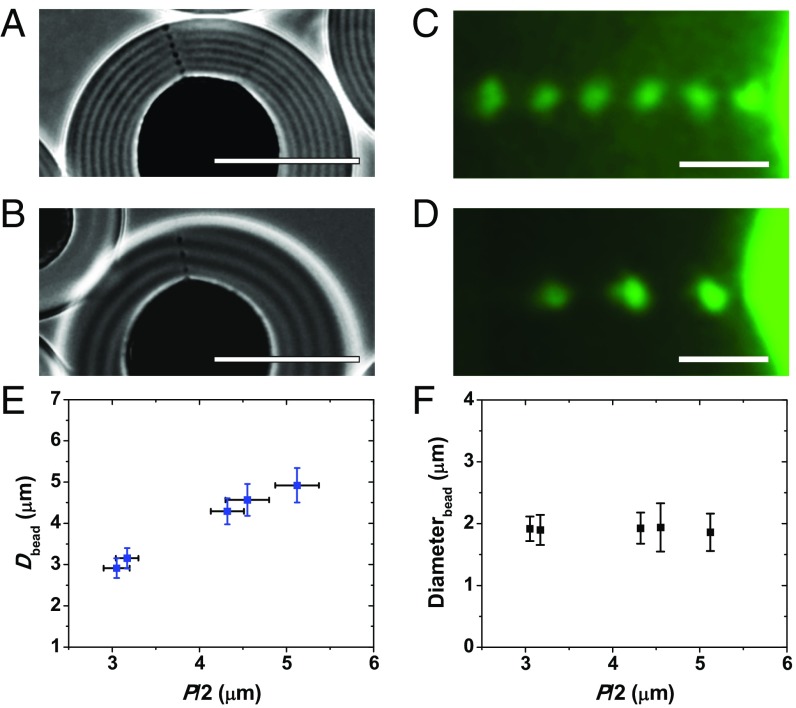
Fig. 4.
Variation in periodicity of the bead array. (A and B) BF images of fragments of the Ch-CNC droplets containing disclinations. Before phase separation, the CNC suspension was subjected to ultrasonication at energy of 340 (A) and 1364 J/g CNCs (B). (Scale bar, 50 μm.) (C and D) FM images of the arrays of beads shown in A and B, respectively. (Scale bar, 5 μm.) (E and F) Variation in the periodicity of the bead array (E) and bead diameter (F), both plotted as a function of P/2. For each data point in E and F, at least 30 droplets were analyzed. The error bars represent the SDs. ϕNP =1.19 × 10⁻²; ϕ0= 4.9 × 10⁻² (A and C) and ϕ0 = 5.5 × 10⁻² (B and D). The results of Student’s t test showed that the average diameter of beads did not change with pitch variation (P > 0.05).

