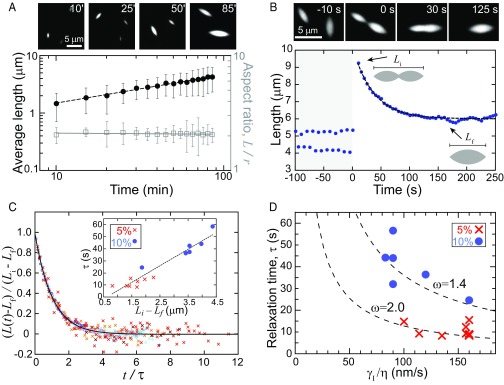
Fig. 3.
Cross-link density regulates interfacial tension and viscosity. (A) Fluorescence images of tactoid growth (1.5 mol % capping protein and 5 mol % filamin), visualized by TMR-actin. Average tactoid length (black closed circles) and aspect ratio (open squares) are shown as a function of time after filamin addition, and dashed line indicates a power law fit L ∼ t α, where α = 0.47 ± 0.01 for four datasets. Error bars represent SD. (B) Fluorescence images of tactoids (1 mol % capping protein and 10 mol % filamin) coalescence. Tactoid length, along the major axis, is shown as a function of time as two initially separate tactoids coalesce. Dashed line is an exponential fit. (C) Tactoid length, rescaled by the deformation length, as a function of time, rescaled by the characteristic relaxation time, for 14 coalescence events (1 mol % capping protein and 5 and 10 mol % filamin) collapses into a master curve. The solid line represents an exponential decay. (Inset) Linear scaling between relaxation time and deformation length from exponential fits of length relaxation. (D) The interfacial tension to viscosity ratio obtained from continuum model fits to the experimental data falls on the theoretically predicted curve for anisotropic droplets.

