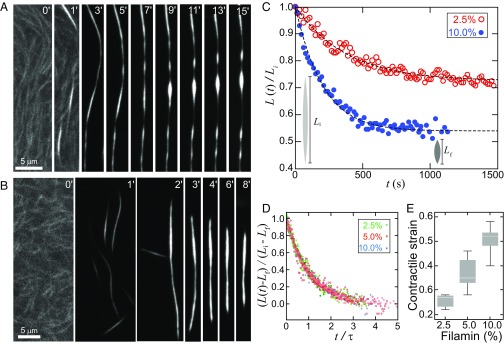
Fig. 4.
Interfacial tension drives instabilities and contraction in fluid F-actin bundles, visualized with TMR-actin. (A) Fluorescence images of an F-actin bundle (0.5 mol % capping protein and 10 mol % filamin) that exhibits instabilities that grow over time. (B) Fluorescence images of an F-actin bundle (0.25 mol % capping protein and 10 mol % filamin) that shortens over time. (C) Bundle length (0.25 mol % capping protein and 2.5 mol %, and 10 mol % filamin) as a function of time. (D) Bundle length, rescaled by the deformation length, as a function of time, rescaled by the characteristic relaxation time collapses on to a single master curve (0.25 mol % capping protein and 2.5, 5, and 10 mol % filamin). (E) Contractile strain increases with cross-linker concentration. Contrast is separately adjusted for prebundled actin images (A, 0′, 1′; B, 0′).

