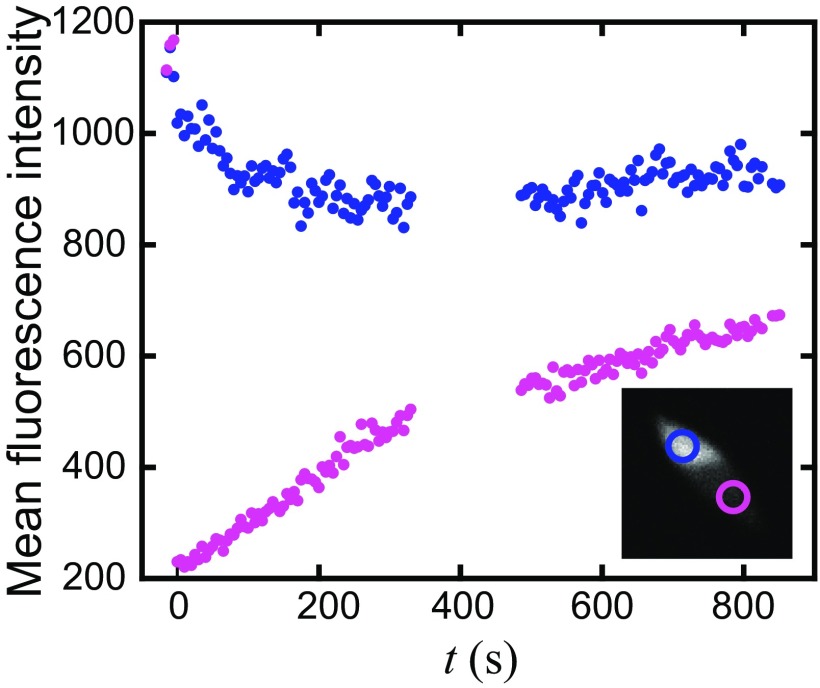
Fig. S1.
Fluorescence intensity after photobleaching data. The mean intensity, background subtracted and corrected for tactoid angle, is plotted for regions (Inset) on the bleached side (purple) and unbleached side (blue). As the fluorescence intensity of the tactoid on the bleached side increases, the intensity on the unbleached side decreases, indicating diffusive mixing of actin filaments.

