Fig. 3.
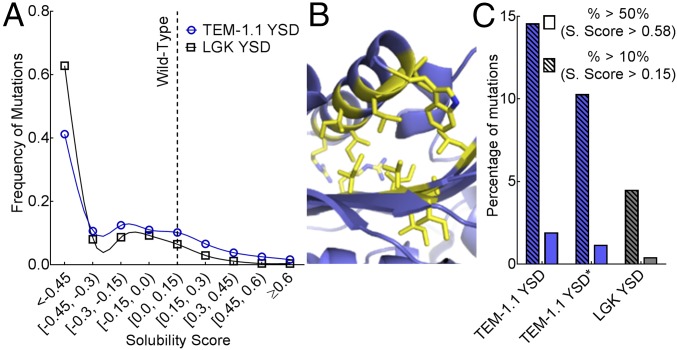
Distribution of solubility-enhancing mutations. (A) Frequency of mutations for TEM-1.1 YSD (blue) and LGK YSD (black) found at each solubility score. Each dataset is fit with a cubic spline to help guide the eye. (B) Positions with more than 10 beneficial mutations in the TEM-1.1 YSD dataset are shown as yellow sticks. These false-positive results are predicted to disrupt the C-terminal helix, presumably to promote accessibility of the c-myc epitope tag. (C) Percentage of mutations with solubility scores above a 10% (hatched fill) and 50% (solid fill) increase in function for TEM-1.1 YSD (blue) and LGK YSD (gray). TEM-1.1 YSD* covers residues 61–215 to remove the section with false-positive results indicated in B.

