Fig. 1.
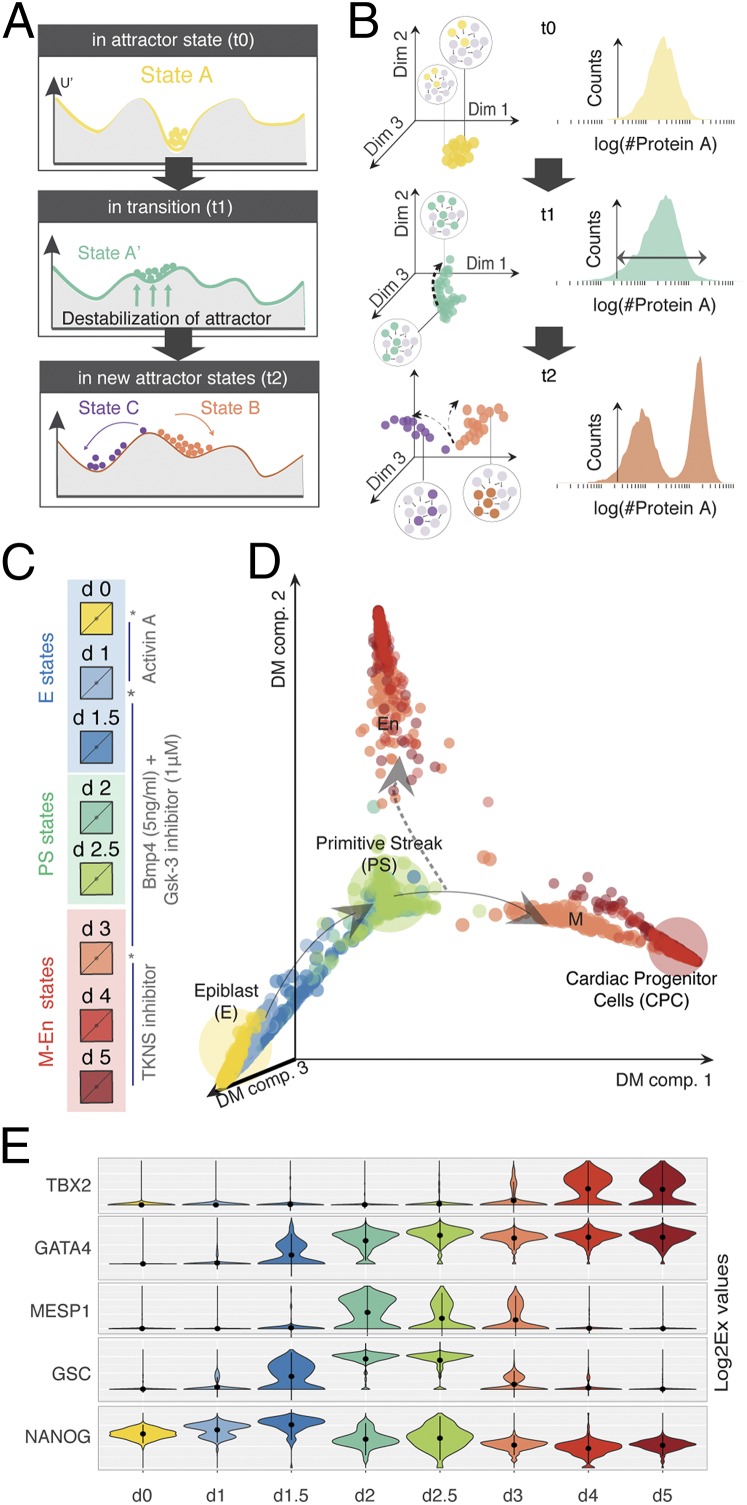
Directed differentiation at single-cell resolution. (A) Theoretical and (B) experimental framework to study cell differentiation as a transition between attractors. Before transition (time t0): Cells in state A (local minima in a quasipotential landscape) are defined by a distinct GRN state (expressed and nonexpressed genes are colored and gray, respectively). The state A attractor manifests as either a dense cloud of points in a high-dimensional cell-state space (as measured using single-cell qPCR) or a tight, uniform distribution of a single gene/dimension (as measured by flow cytometry) as shown in B. The tipping point (time t1): The attractor destabilizes (via changes in the quasipotential landscape), and cells become primed toward a future attractor state(s). Cells in the poised state A' exhibit increased cell diversity, which manifests as a shift in the high-dimensional state space or a wider distribution in a single dimension. Posttransition (time t2): Stable states B and C emerge through the stabilization of mutually exclusive GRN states that can be observed as two clouds occupying distinct positions in the high-dimensional cell-state space or bimodal distribution of the marker gene as shown in B. (C) Snapshot of the iPSC to iCM differentiation protocol used in this study. Asterisks mark the perturbation time points (days 0, 1, and 3) that also correspond to cell culture media exchanges. (D) Diffusion map (DM) of the iPSC to iCM differentiation based on 1,934 single-cell gene expression vectors of 96 genes. Color of each dot represents the day of collection during differentiation. Arrows indicate the direction of cell-state trajectories. The dashed arrow points toward the undesired cell state. (E) Dynamics of state-specific transcription factors. The violin plots show the variability of gene expression (log2Ex) across each cell population for five transcription factors: NANOG (stem cell marker), GSC (PS marker), MESP1 (posterior PS/cardiac mesoderm marker), GATA4 (mesoderm and endoderm marker), and TBX2 (cardiac marker).

