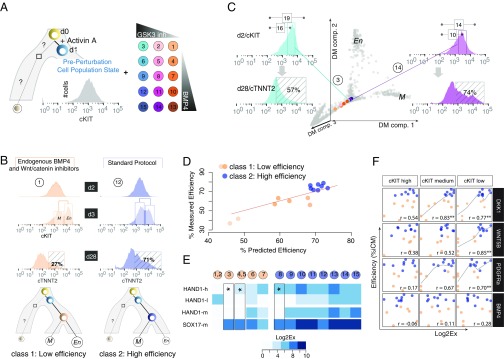
Fig. 4.
Cell-state diversity at the tipping point predicts differentiation efficiency. (A) Perturbation scheme to influence the M–En branching event on day 3. In total, we tested 15 BMP4/GSK3 inhibitor combinations highlighted with a unique color or number in a circle across all panels herein. (B) Dynamics of the cKIT distribution during early differentiation reflect the effect of each small molecule combination. We observed different cKIT distributions on days 2 and 3 for each treatment (flow cytometry data shown in Fig. S8), which inform predictions about protocol efficiency as measured by the proportion of cTNNT2+ cells—the most commonly used molecules to show the cardiac fate—on day 28 (shown in striped boxes). (C) Projections of the 100-cell pool cKITHigh, cKITMedium, and cKITLow gene expression profiles onto the diffusion map (DM). The single-cell gene expression profiles are shown in gray, and combination-specific, population-specific pooled gene expression vectors are represented with the corresponding colors from A. The position in the trajectory at day 2 as well as the variable distribution of cKIT outlier fractions (shown as numbers in boxes above histograms) can explain huge variation in the efficiencies of the protocols (measured as cTNNT2+ cells at day 28). (D) Random Forest analysis to identify transcripts or cell subpopulations that predict high- vs. low-efficiency protocols. We classified every combination that produces >60% iCMs as high efficiency (dark blue), whereas any combination with efficiency <60% was classified as low efficiency (orange). (E) The cKITHigh, cKITMedium, and cKITLow concatenated gene expression vectors outperform the cKITMedium vector classification. HAND1 gene expression in cKITHigh and cKITLow populations discriminates between three different combinations with different efficiencies (marked by asterisks), whereas SOX17 and HAND1 gene expression in cKITMedium population is the same. (F) Correlation plots for signaling molecules and combination class (low vs. high efficiency). Low-efficiency protocols are marked by lower dosages of exogenous BMP4 (<2.5 μM), but it seems that there is no correlation between exogenous administration and endogenous BMP4 levels (measured as gene expression; no correlation). However, higher dosages of exogenous BMP4 are highly correlated with the expression levels of DKK1 and Wnt5B in the cKITLow population that will commit to the cardiac cell fate. Again, cKITHigh or cKITLow gene expression vectors perform better than cKITMedium.

