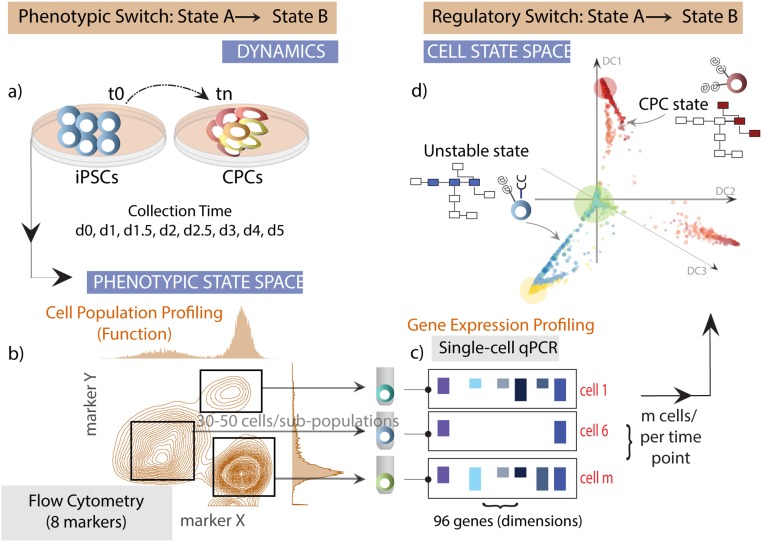
Fig. S1.
An integrative systems biology approach to study cell differentiation. We integrated single-cell qPCR measurements with flow cytometry to connect the phenotypic states (cell surface marker profile) to the regulatory states (transcription factor expression profile). (A) Single cells are collected using flow cytometry at specific time points as iPSCs differentiate to cardiac progenitors cells (CPCs) as described in the methods for downstream single-cell and population analyses. (B) We monitor the dynamics for eight specific cell surface markers, and individual cells from distinct cell populations are sorted into wells of a 96-well plate containing a buffer optimized for single-cell cDNA synthesis. (C) We performed qPCR on cDNA generated from sorted single cells using Fluidigm’s microfluidics-based platform (Biomark). The expression level of 96 genes (composed of transcription factors, signal transducers, and cell surface proteins) was measured in ∼1,900 individual cells. (D) Finally, we performed a rigorous computational analysis of single-cell gene expression data based on clustering, dimensionality reduction, and correlation analysis to map gene regulatory states and identify the differentiation trajectories and branch points.

