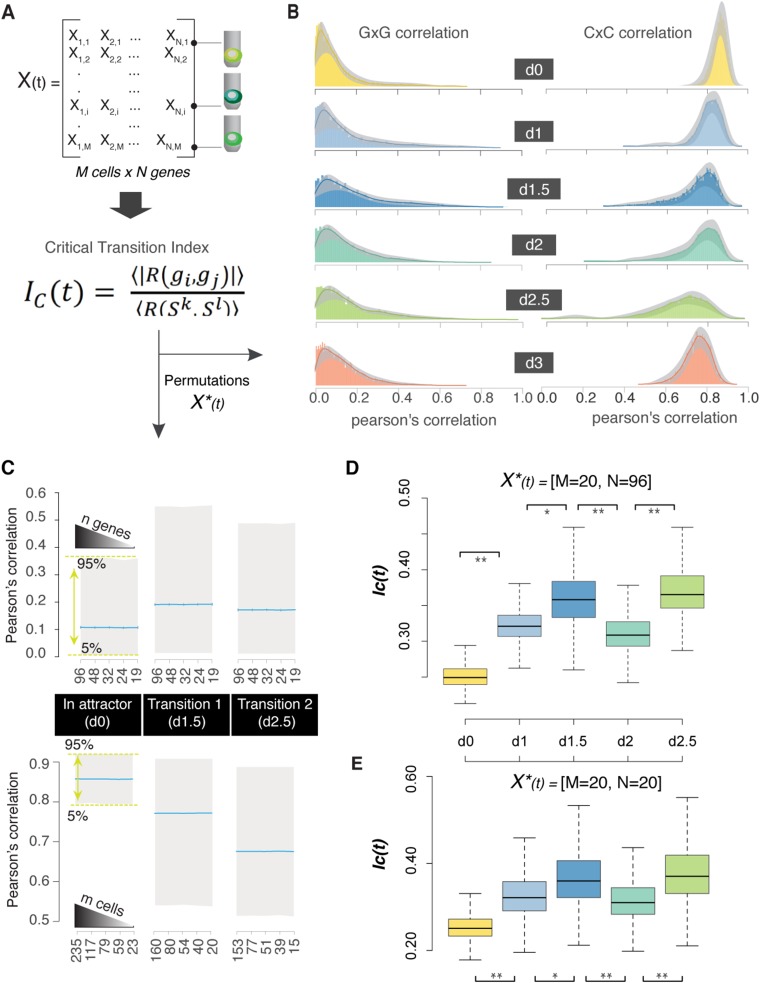
Fig. S3.
Robustness of the IC values using bootstrap analysis. (A) Time point-specific matrices—X(t)—were generated based on the Log2Ex gene expression values (columns correspond to genes, and rows correspond to cells). After bifurcation, we generated time- and lineage-specific matrices (i.e., cells that cluster as M lineage on day 3). For each matrix, we calculated the critical transition index. (B) Dynamics of gene to gene (GxG) and cell to cell (CxC) correlations. Solid lines correspond to the density plot based on the correlation values of the X(t), whereas the gray regions show the confidence intervals (5 and 95%) computed from 1,000 permutations of 50 randomly selected cells for each population [X*(t) = 50 cells × 96 genes]. (C) Boxplots present the distribution of Pearson’s correlation values from 1,000 permutations of n randomly selected genes [X*(t) = n genes × M cells] or m randomly selected cells [X*(t) = N genes × m cells] for each time point. Blue lines indicate the mean values that are used for the IC(t) calculations. The graph shows that mean values for both GxG and CxC correlations, as a component of the IC index, are not affected by the number of selected variables. (D and E) Boxplots present the distribution of IC(t) values from 1,000 permutations with specific matrix sizes: X*(t) = 96 genes × 20 cells or X*(t) = 20 genes × 20 cells. As expected, the size of the vector (n = 96 vs. n = 20) influences the possible index value, although the trend (increasing during transitions) remains constant; the relative trend is there. *P value < 5e-10 for comparison between the time points (Kolmogorov–Smirnov test and Wilcoxon rank sum test); **P value < 2e-10 for comparison between the time points (Kolmogorov–Smirnov test and Wilcoxon rank sum test).

