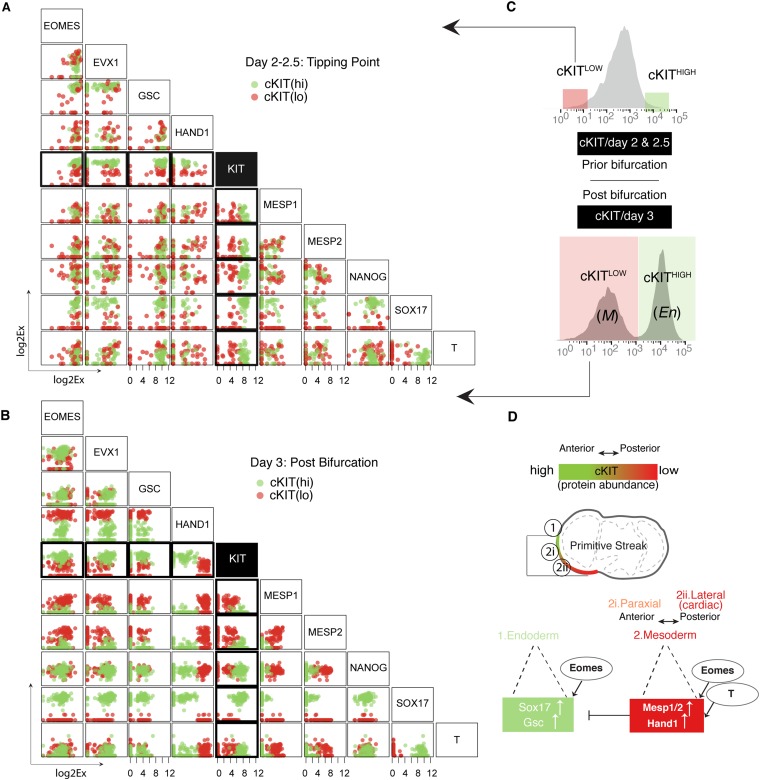
Fig. S6.
cKIT protein abundance correlates with anterior–posterior patterning factors. (A) Correlation plots for nine transcription factors and c-KIT for days 2 and 2.5 (prior bifurcation). The color corresponds to the phenotypic properties of the cells (more specifically, the protein abundance of cell surface marker cKIT; C). (B) Correlation plots for nine transcription factors and c-KIT for day 3 (postbifurcation). The color corresponds to the phenotypic properties of the cells (more specifically, the protein abundance of cell surface marker cKIT; C). (C) Flow cytometry analysis for cKIT protein. Boxes illustrate the fraction of populations that was analyzed as cKITLOW–cKIT(lo) or cKITHIGH—cKIT(hi). (D) A model for anterior–posterior patterning of PS. cKITHIGH correlates with En cell fates that are located in the most anterior part of PS and express high levels of SOX17 and GSC. The rest of the PS correlates with cKITLOW and associates with M cell fates.

