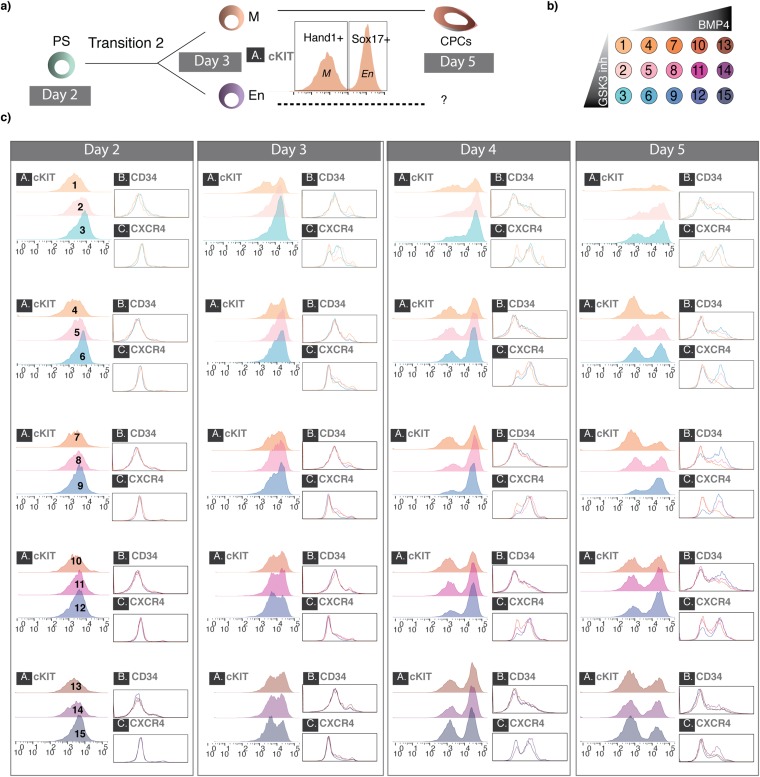
Fig. S8.
Cell population dynamics during early iCM differentiation based on individual protein markers. (A) A model of M–En bifurcation after the PS-like state on day 2 helps to navigate the cell population dynamics (i.e., bimodality of certain markers after day 3). Cell state abbreviations: CPC, cardiac progenitor cell; En, endoderm; M, mesoderm; PS, primitive streak. (B) Representation of the perturbation matrix used to explore the effect of exogenous cues during early cardiomyocyte differentiation. Each color represents a unique BMP4–GSK3 inhibitor combination (GSK3 inhibitor: 0, 0.5, and 1 μM; BMP4, 0, 1.25, 2.5, 5, and 10 ng/mL). In total, there are 15 combinations, and each combination is assigned to a number (1–15) that is used in C. (C) Individual columns represent days during differentiation postinduction with Activin. Each panel in the columns represents three concentrations of GSK3 inhibitor for each BMP4 concentration. FACS plots are marked as in B for each BMP4–GSK3 inhibitor combination and represent expression for (A) cKIT, (B) CD34, and (C) CXCR4.

