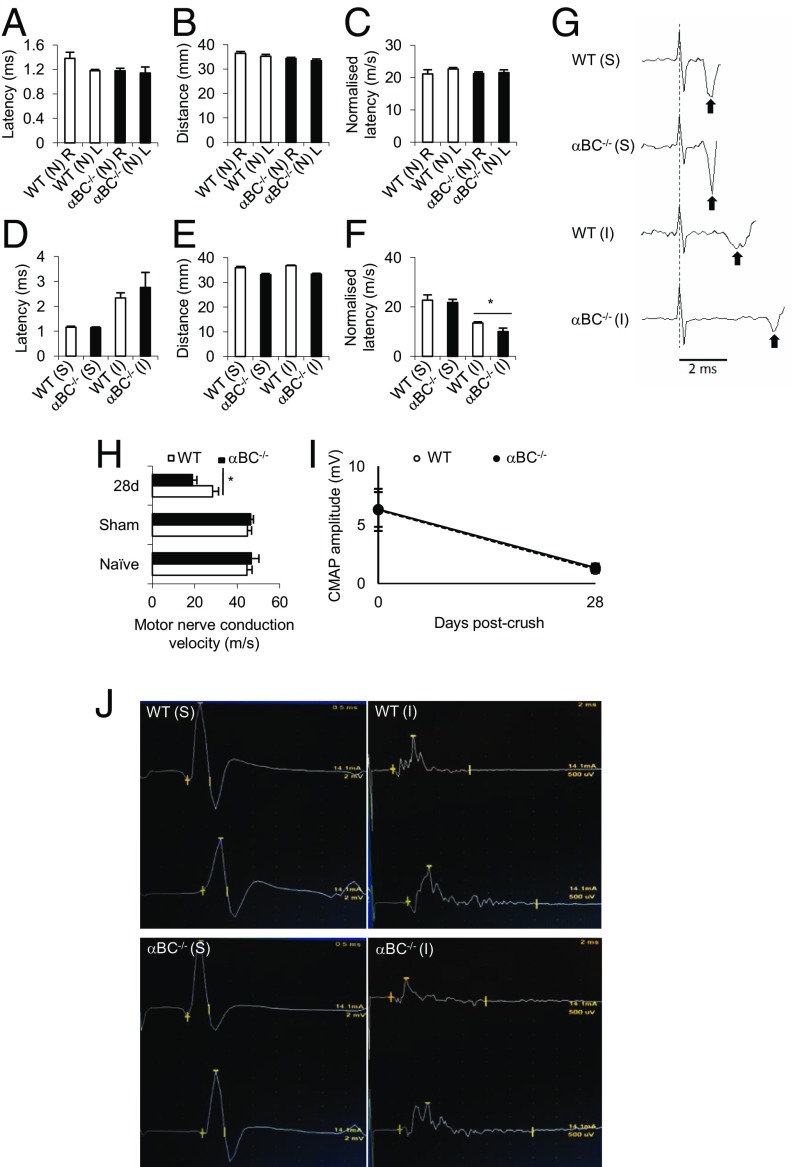
Fig. 3.
Electrophysiological properties of motor axons in sciatic nerves of WT and αBC−/− mice after crush injury. (A and D) Latency, (B and E) distance, and (C and F) normalized latency in (A–C) naïve (N) and (D–F) 28-d postsurgery sham (S) and injured (I) WT (white bars) and αBC−/− (black bars) mice after a single-point stimulation of the sciatic nerve (one experiment; n = 5 per group). *P < 0.05 (two-way ANOVA). (G) An example of the raw data for the normalized latency reflecting mean data represented in F. The dotted line indicates the stimulus artifact, and the black arrows indicate the first poststimulus voltage deflections associated with the arrival of motor volley near the recording electrode. The latency was measured from the dashed line to the arrows. Trace is an average of 20 individual stimulus trials. (H) MNCV in naïve, sham, and 28-d postdamaged WT (white bars) and αBC−/− (black bars) animals (representative of two experiments; n = 9–10 mice per arm). *P < 0.05 (two-way repeated measures ANOVA). (I) CMAP amplitude of sham (0) and 28-d injured WT and αBC−/− mice. (J) Representative traces of the raw data from which the CMAP data and MNCV were derived in sham (S) and 28-d injured (I) WT and αBC−/− mice.

