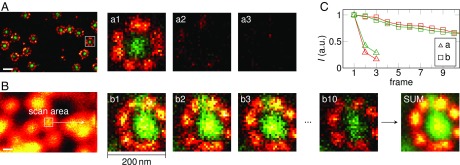
Fig. 2.
Fluorescence signal increases when limiting the image field of STED nanoscopy to subdiffraction dimensions. The MINFIELD bleaching reduction is exemplified on amphibian nuclear pore complexes (NPCs) labeled with an anti-gp210 (red) and an anti-FG repeat Nup (green) antibody. (A) Details of the NPC structure are easily resolved in a conventional STED recording (full image in Fig. S3). However, due to photobleaching, acquiring several images was precluded in this case; the images a1–a3 show the fluorescence signal of the highlighted area in subsequent recordings. (B) MINFIELD STED microscopy: reducing the scan area to the structure of interest increases the signal, as long as the area is smaller than the focal extent of the excitation and STED beams. To determine areas of interest, a low-resolution confocal image is acquired first. The selected area is then scanned multiple times (b1–b10) with high resolution. The signal can be summed up (SUM) or evaluated frame by frame. Color scale values (min, max) for this and all other image data are provided in Table S2, and the color scales are in Fig. S8. (C) Signals upon repeated imaging in the red and green channel of the images shown in a1–a3 and b1–b10. (Scale bars: 200 nm.)

