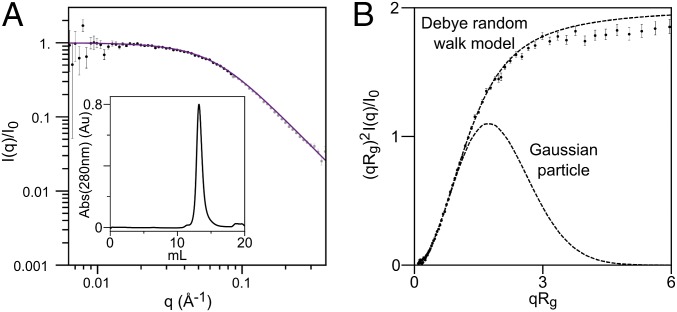
Fig. 5.
SAXS on reduced and unfolded sfAFP. (A) Data are fit to a Debye random walk model out to qRg ≤ 2 (black versus gray data points). (Inset) SEC elution profile. (B) Data, presented in the form of a dimensionless Kratky plot, are compared with that for a random walk and a Gaussian particle. The protein in 10 mM DTT was injected onto a SEC column equilibrated with 2 mM DTT, pH 7.4.

