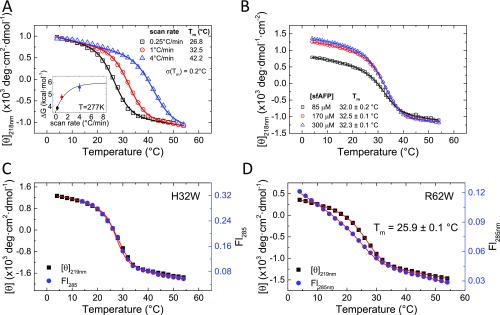
Fig. S1.
Thermal denaturation of tryptophan variants of sfAFP monitored using CD and Trp fluorescence. (A) Denaturation at different rates of temperature increase. (Inset) ΔG calculated at 277 K from the fits of the three different scan rates and assuming a change in heat capacity of ΔCp = 0.408 kcal·mol−1·K−1 (23). Extrapolation to an infinite scan rate is made by fitting the calculated parameters to a single-exponential model (Table S1). (B) Thermal denaturation as a function of protein concentration for WT sfAFP exhibits similar transition and baseline behavior (potential concentration scaling error). Thermal denaturation for H32W (C) and R62W (D) exhibits concurrent changes in CD and Fl as the temperature is increased at a rate of 1 °C⋅min−1. Steep fluorescent baselines have been observed in other two-state proteins as well, for example, CI2 (19). Due to the steepness of the native baseline in the fluorescence transition, the two datasets for R62W are simultaneously fit with the same Tm, ΔH, and ΔCp.

